CLT for Generalized Linear Spectral Statistics of High-dimensional Sample Covariance Matrices and Applications
Publication
Metrics
AI Quick Summary
This paper establishes the central limit theorem (CLT) for Generalized Linear Spectral Statistics (GLSS) of high-dimensional sample covariance matrices, showing their joint asymptotic normality under certain conditions. The paper proposes a new hypothesis testing method based on GLSS for analyzing spiked covariance matrices, demonstrated through numerical studies.
Paper Preview
Abstract
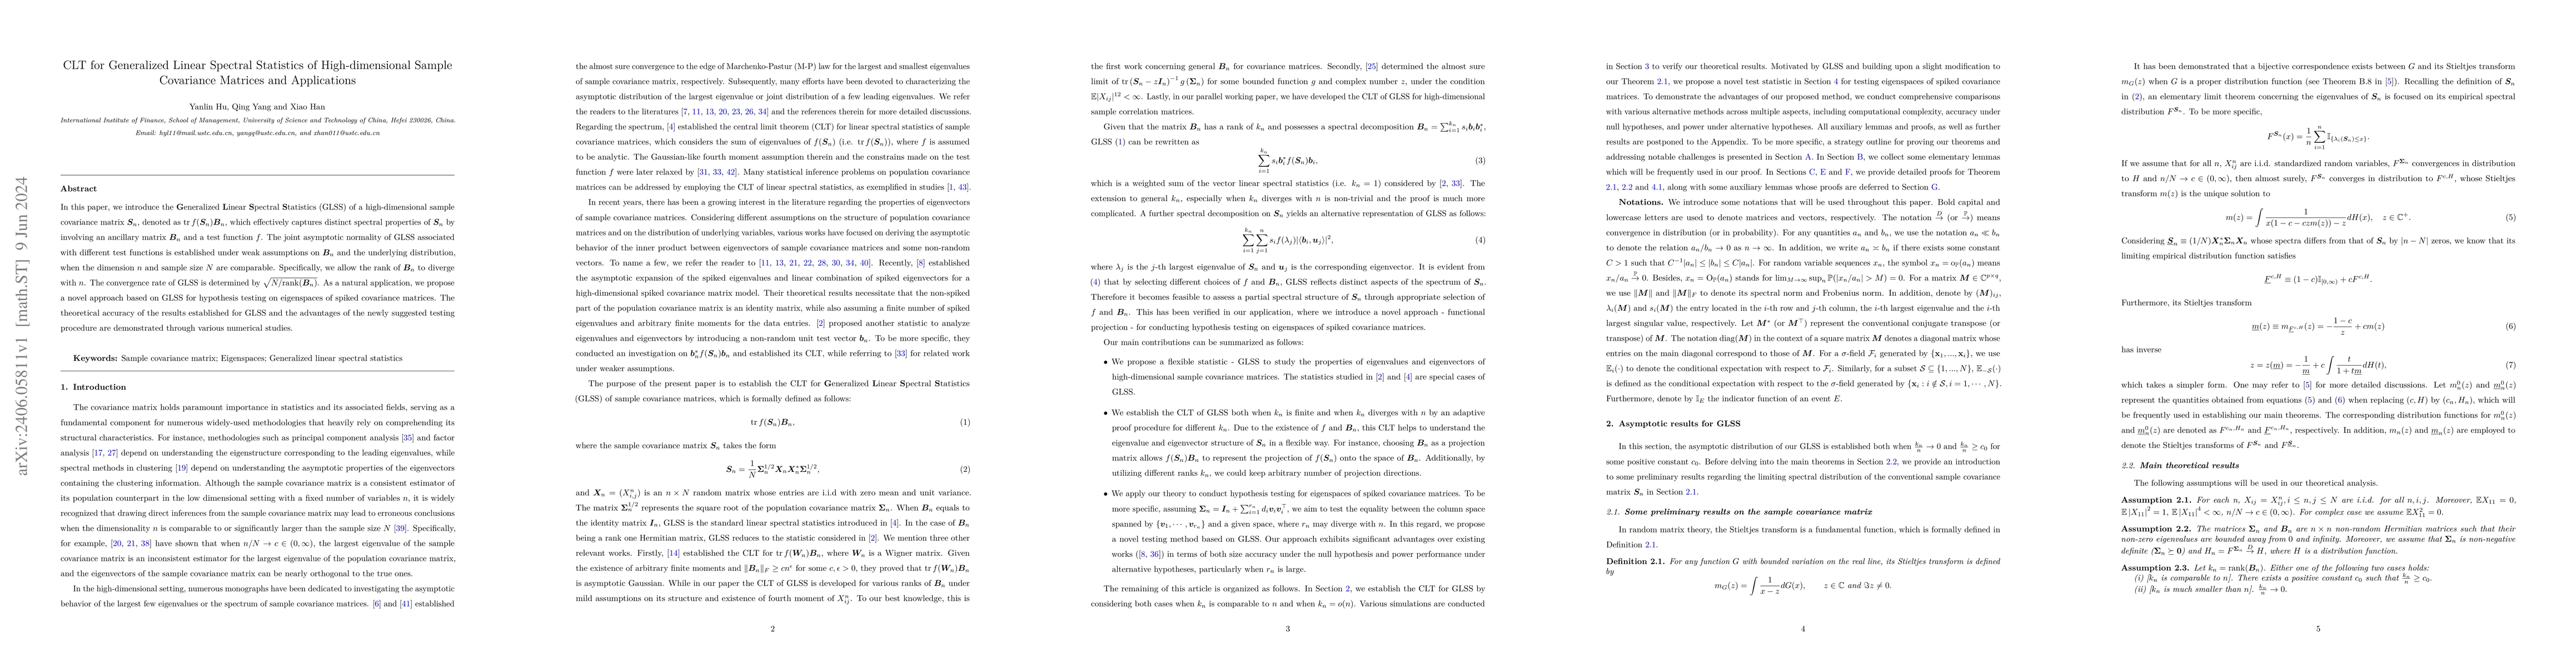
In this paper, we introduce the $\mathbf{G}$eneralized $\mathbf{L}$inear $\mathbf{S}$pectral $\mathbf{S}$tatistics (GLSS) of a high-dimensional sample covariance matrix $\mathbf{S}_n$, denoted as $\operatorname{tr}f(\mathbf{S}_n)\mathbf{B}_n$, which effectively captures distinct spectral properties of $\mathbf{S}_n$ by involving an ancillary matrix $\mathbf{B}_n$ and a test function $f$. The joint asymptotic normality of GLSS associated with different test functions is established under weak assumptions on $\mathbf{B}_n$ and the underlying distribution, when the dimension $n$ and sample size $N$ are comparable. Specifically, we allow the rank of $\mathbf{B}_n$ to diverge with $n$. The convergence rate of GLSS is determined by $\sqrt{{N}/{\operatorname{rank}(\mathbf{B}_n)}}$. As a natural application, we propose a novel approach based on GLSS for hypothesis testing on eigenspaces of spiked covariance matrices. The theoretical accuracy of the results established for GLSS and the advantages of the newly suggested testing procedure are demonstrated through various numerical studies.
AI Key Findings
Get AI-generated insights about this paper's methodology, results, significance, and more — seven facets brought into focus.
Paper Details
Authors
PDF Preview
Key Terms
Related Papers
No references found for this paper.
Discussion 0