CLT for Linear Spectral Statistics in High-Dimensional Random Effects Models
Publication
Metrics
AI Quick Summary
This paper demonstrates a Central Limit Theorem (CLT) for linear spectral statistics (LSS) of high-dimensional sample covariance matrices arising from multi-level variance components. The study shows that as dimensions grow, LSS converge to a standard multivariate Gaussian distribution, facilitating estimation in quantitative genetics for nested linear random-effects models.
Paper Preview
Abstract
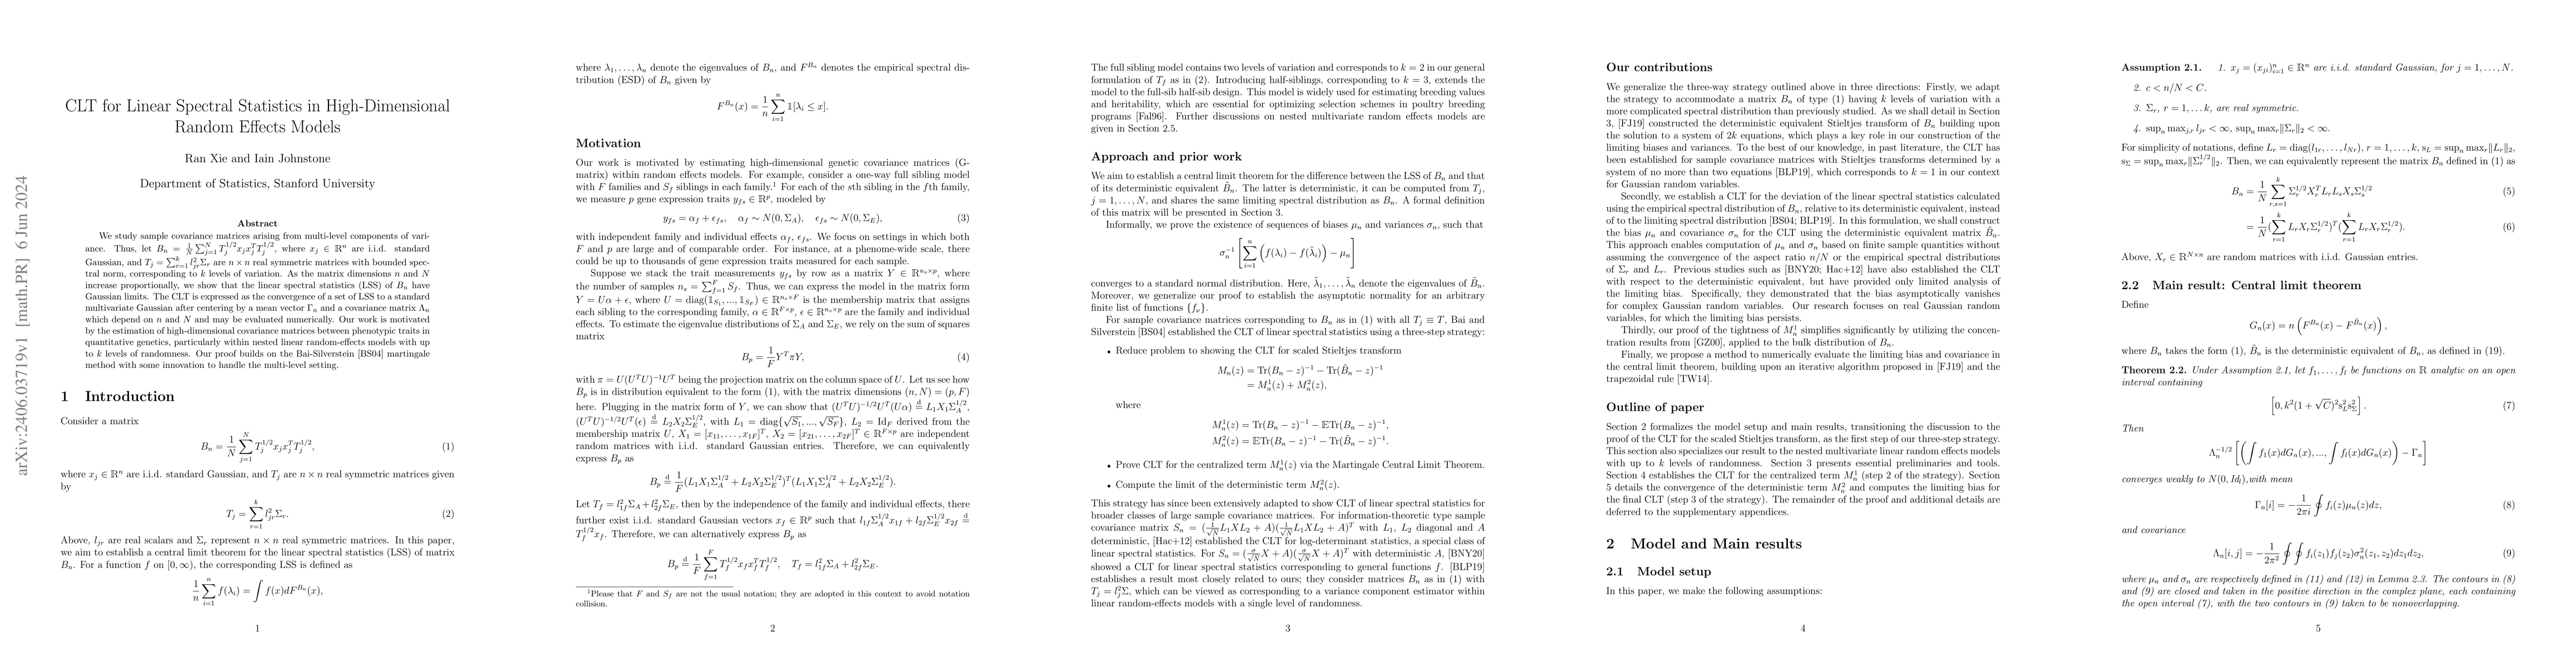
We study sample covariance matrices arising from multi-level components of variance. Thus, let $ B_n=\frac{1}{N}\sum_{j=1}^NT_{j}^{1/2}x_jx_j^TT_{j}^{1/2}$, where $x_j\in R^n$ are i.i.d. standard Gaussian, and $T_{j}=\sum_{r=1}^kl_{jr}^2\Sigma_{r}$ are $n\times n$ real symmetric matrices with bounded spectral norm, corresponding to $k$ levels of variation. As the matrix dimensions $n$ and $N$ increase proportionally, we show that the linear spectral statistics (LSS) of $B_n$ have Gaussian limits. The CLT is expressed as the convergence of a set of LSS to a standard multivariate Gaussian after centering by a mean vector $\Gamma_n$ and a covariance matrix $\Lambda_n$ which depend on $n$ and $N$ and may be evaluated numerically. Our work is motivated by the estimation of high-dimensional covariance matrices between phenotypic traits in quantitative genetics, particularly within nested linear random-effects models with up to $k$ levels of randomness. Our proof builds on the Bai-Silverstein \cite{baisilverstein2004} martingale method with some innovation to handle the multi-level setting.
AI Key Findings
Get AI-generated insights about this paper's methodology, results, significance, and more — seven facets brought into focus.
Paper Details
Authors
PDF Preview
Key Terms
Related Papers
No references found for this paper.
Discussion 0