ClusterGraph: a new tool for visualization and compression of multidimensional data
Publication
Metrics
AI Quick Summary
ClusterGraph enhances visualization and compression of multidimensional data by combining clustering techniques with Topological Data Analysis to reveal the global structure of clusters, offering improved data representation and simplification for analysis. The tool complements traditional dimensionality reduction and clustering methods for better data exploration.
Paper Preview
Abstract
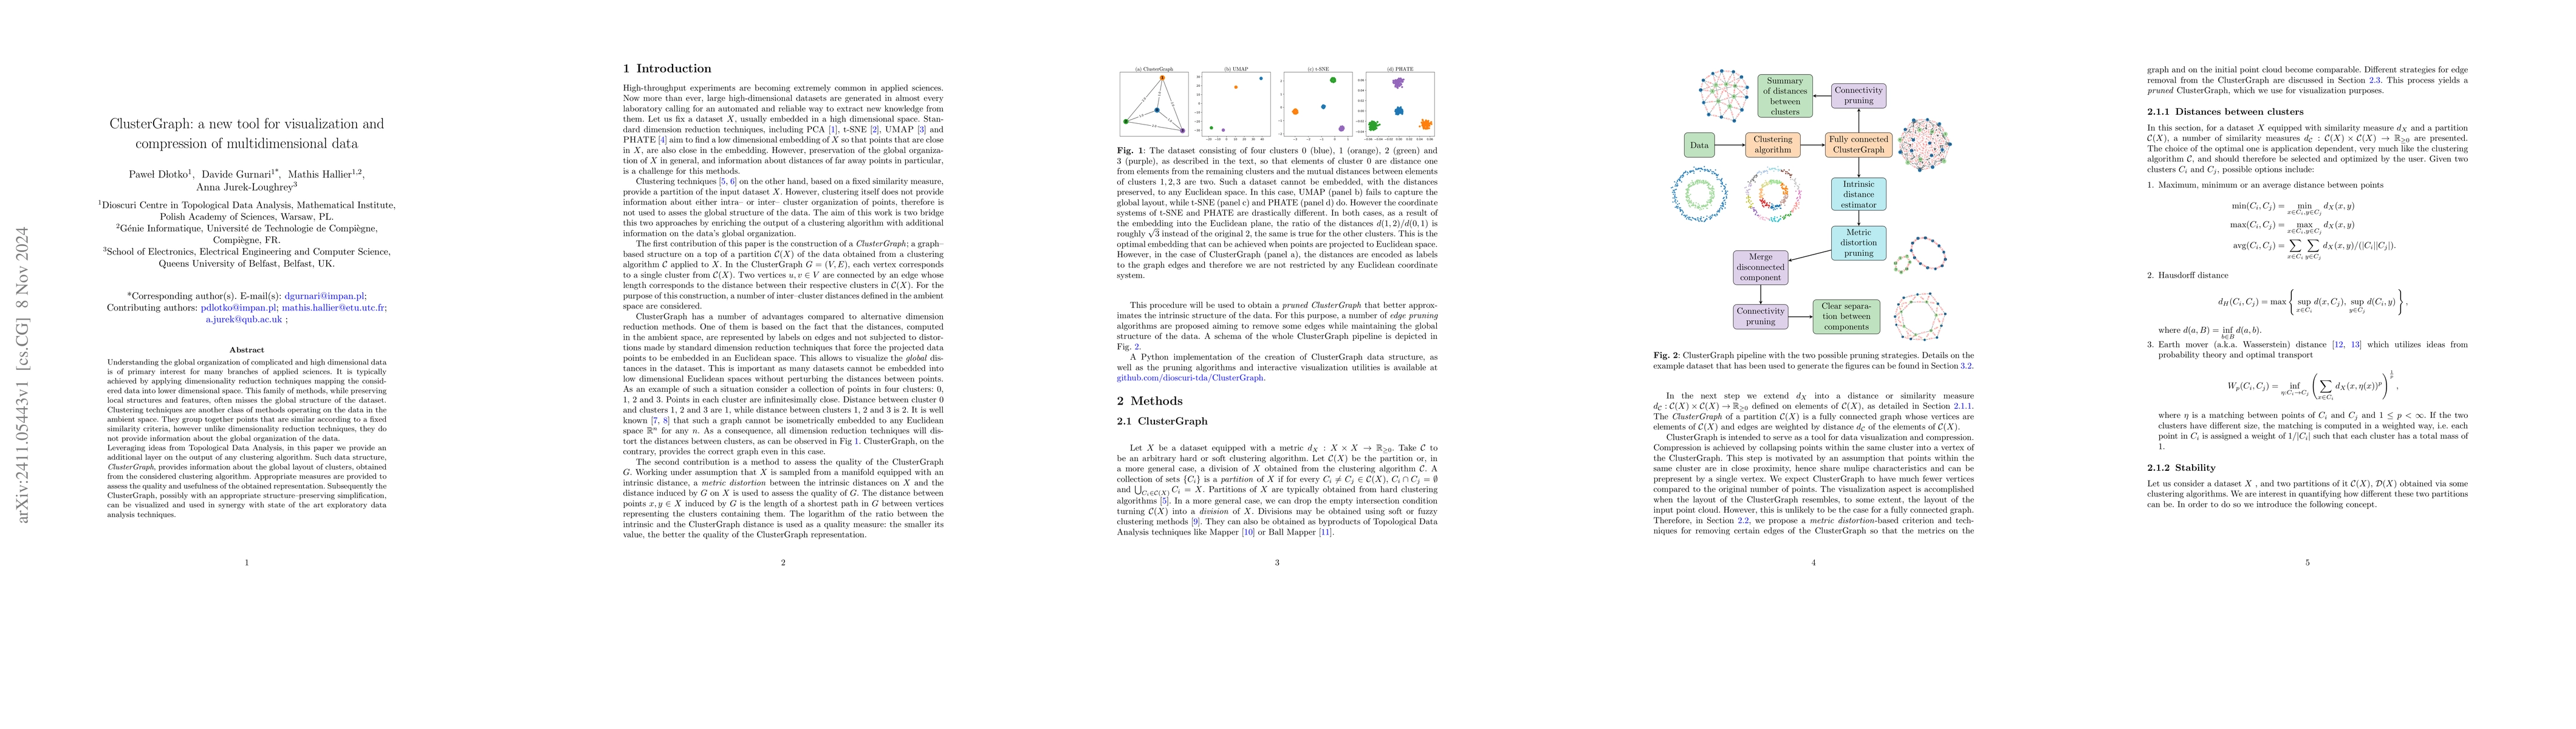
Understanding the global organization of complicated and high dimensional data is of primary interest for many branches of applied sciences. It is typically achieved by applying dimensionality reduction techniques mapping the considered data into lower dimensional space. This family of methods, while preserving local structures and features, often misses the global structure of the dataset. Clustering techniques are another class of methods operating on the data in the ambient space. They group together points that are similar according to a fixed similarity criteria, however unlike dimensionality reduction techniques, they do not provide information about the global organization of the data. Leveraging ideas from Topological Data Analysis, in this paper we provide an additional layer on the output of any clustering algorithm. Such data structure, ClusterGraph, provides information about the global layout of clusters, obtained from the considered clustering algorithm. Appropriate measures are provided to assess the quality and usefulness of the obtained representation. Subsequently the ClusterGraph, possibly with an appropriate structure--preserving simplification, can be visualized and used in synergy with state of the art exploratory data analysis techniques.
AI Key Findings
Get AI-generated insights about this paper's methodology, results, significance, and more — seven facets brought into focus.
Paper Details
Authors
PDF Preview
Related Papers
No references found for this paper.
Discussion 0