Publication
Metrics
AI Quick Summary
Clusterplot offers a new visualization tool to explore high-dimensional clusters, using 2D blobs to represent cluster relations and facilitating an intuitive understanding of cluster inter-relations.
Paper Preview
Abstract
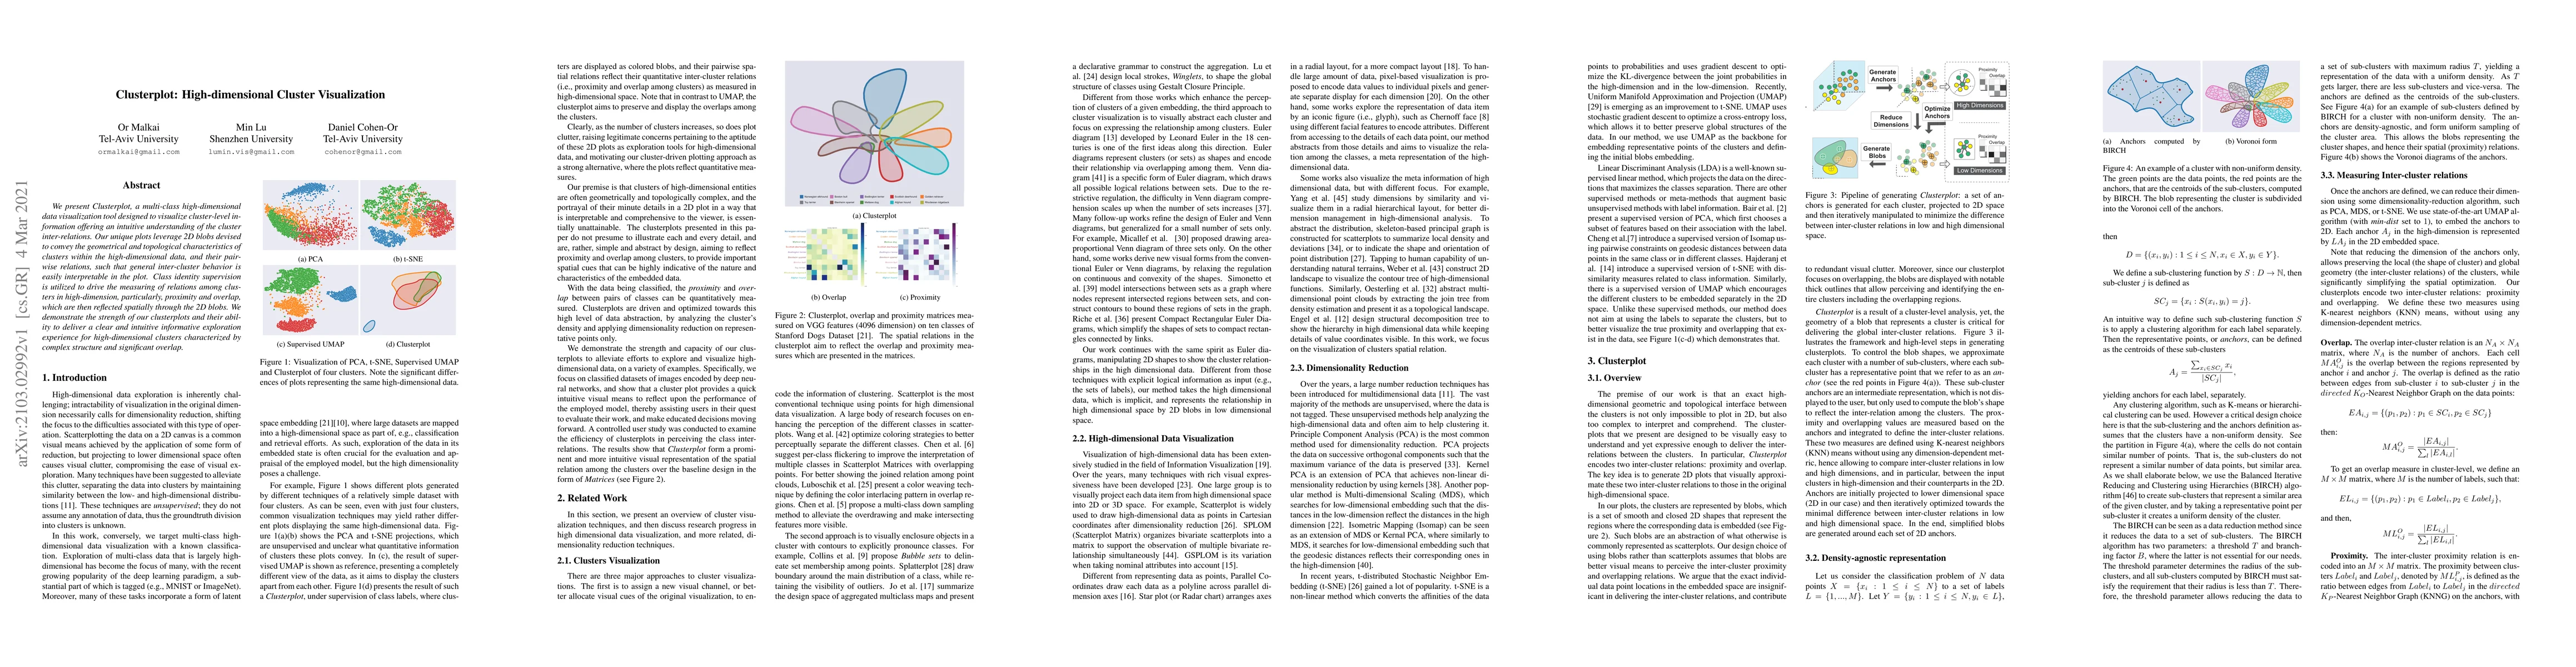
We present Clusterplot, a multi-class high-dimensional data visualization tool designed to visualize cluster-level information offering an intuitive understanding of the cluster inter-relations. Our unique plots leverage 2D blobs devised to convey the geometrical and topological characteristics of clusters within the high-dimensional data, and their pairwise relations, such that general inter-cluster behavior is easily interpretable in the plot. Class identity supervision is utilized to drive the measuring of relations among clusters in high-dimension, particularly, proximity and overlap, which are then reflected spatially through the 2D blobs. We demonstrate the strength of our clusterplots and their ability to deliver a clear and intuitive informative exploration experience for high-dimensional clusters characterized by complex structure and significant overlap.
AI Key Findings
Get AI-generated insights about this paper's methodology, results, significance, and more — seven facets brought into focus.
Impact
Paper Details
Authors
PDF Preview
Key Terms
Citation Network
Current paper (gray), citations (green), references (blue)
Display is limited for performance on very large graphs.
Discussion 0