Coarse Retinal Lesion Annotations Refinement via Prototypical Learning
Publication
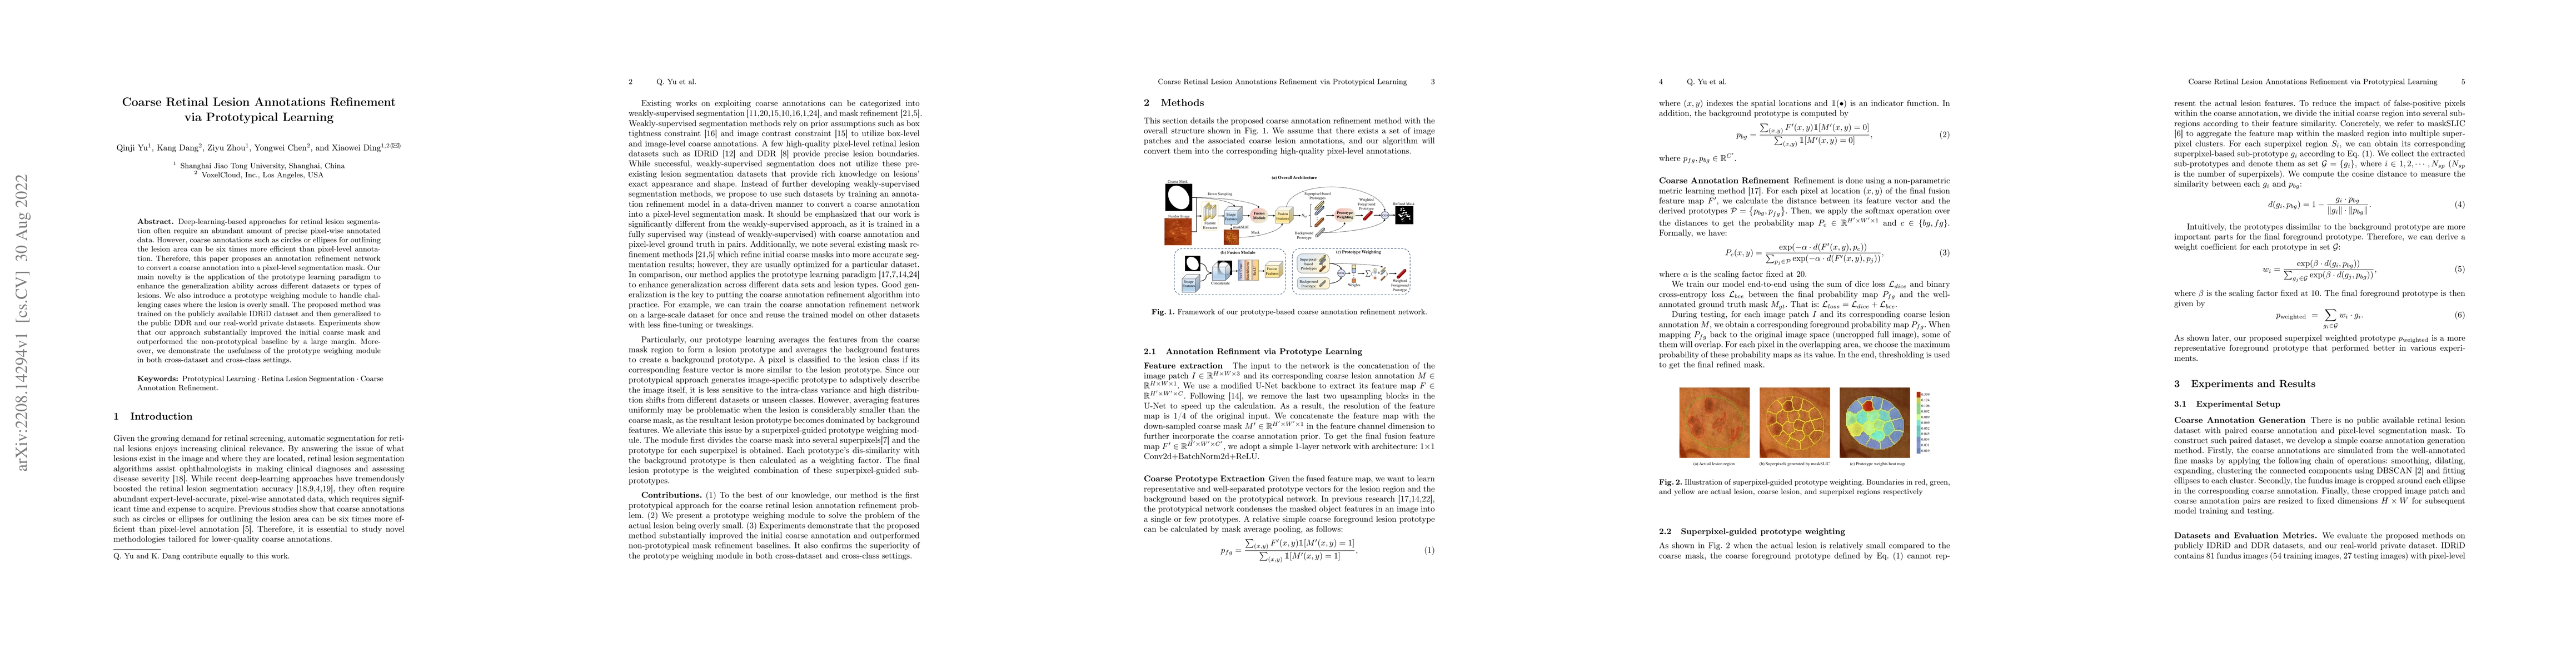
Metrics
AI Quick Summary
This paper proposes an annotation refinement network that converts coarse lesion annotations into precise pixel-level segmentation masks using prototype learning to enhance generalization. The method was tested on multiple datasets, showing significant improvements over non-prototypical baselines and effective handling of small lesions.
Paper Preview
Abstract
Deep-learning-based approaches for retinal lesion segmentation often require an abundant amount of precise pixel-wise annotated data. However, coarse annotations such as circles or ellipses for outlining the lesion area can be six times more efficient than pixel-level annotation. Therefore, this paper proposes an annotation refinement network to convert a coarse annotation into a pixel-level segmentation mask. Our main novelty is the application of the prototype learning paradigm to enhance the generalization ability across different datasets or types of lesions. We also introduce a prototype weighing module to handle challenging cases where the lesion is overly small. The proposed method was trained on the publicly available IDRiD dataset and then generalized to the public DDR and our real-world private datasets. Experiments show that our approach substantially improved the initial coarse mask and outperformed the non-prototypical baseline by a large margin. Moreover, we demonstrate the usefulness of the prototype weighing module in both cross-dataset and cross-class settings.
AI Key Findings
Get AI-generated insights about this paper's methodology, results, significance, and more — seven facets brought into focus.
Impact
Paper Details
Authors
PDF Preview
Key Terms
Citation Network
Current paper (gray), citations (green), references (blue)
Display is limited for performance on very large graphs.
Discussion 0