Publication
Metrics
AI Quick Summary
The paper introduces encube, a collaborative visual analytics framework for large radio survey datasets, addressing limitations in interactive data analysis, collaboration, and workflow documentation. It supports both high-end display systems like CAVE2 and standard desktops, featuring modular components for computation, visualization, interaction, and data management.
Paper Preview
Abstract
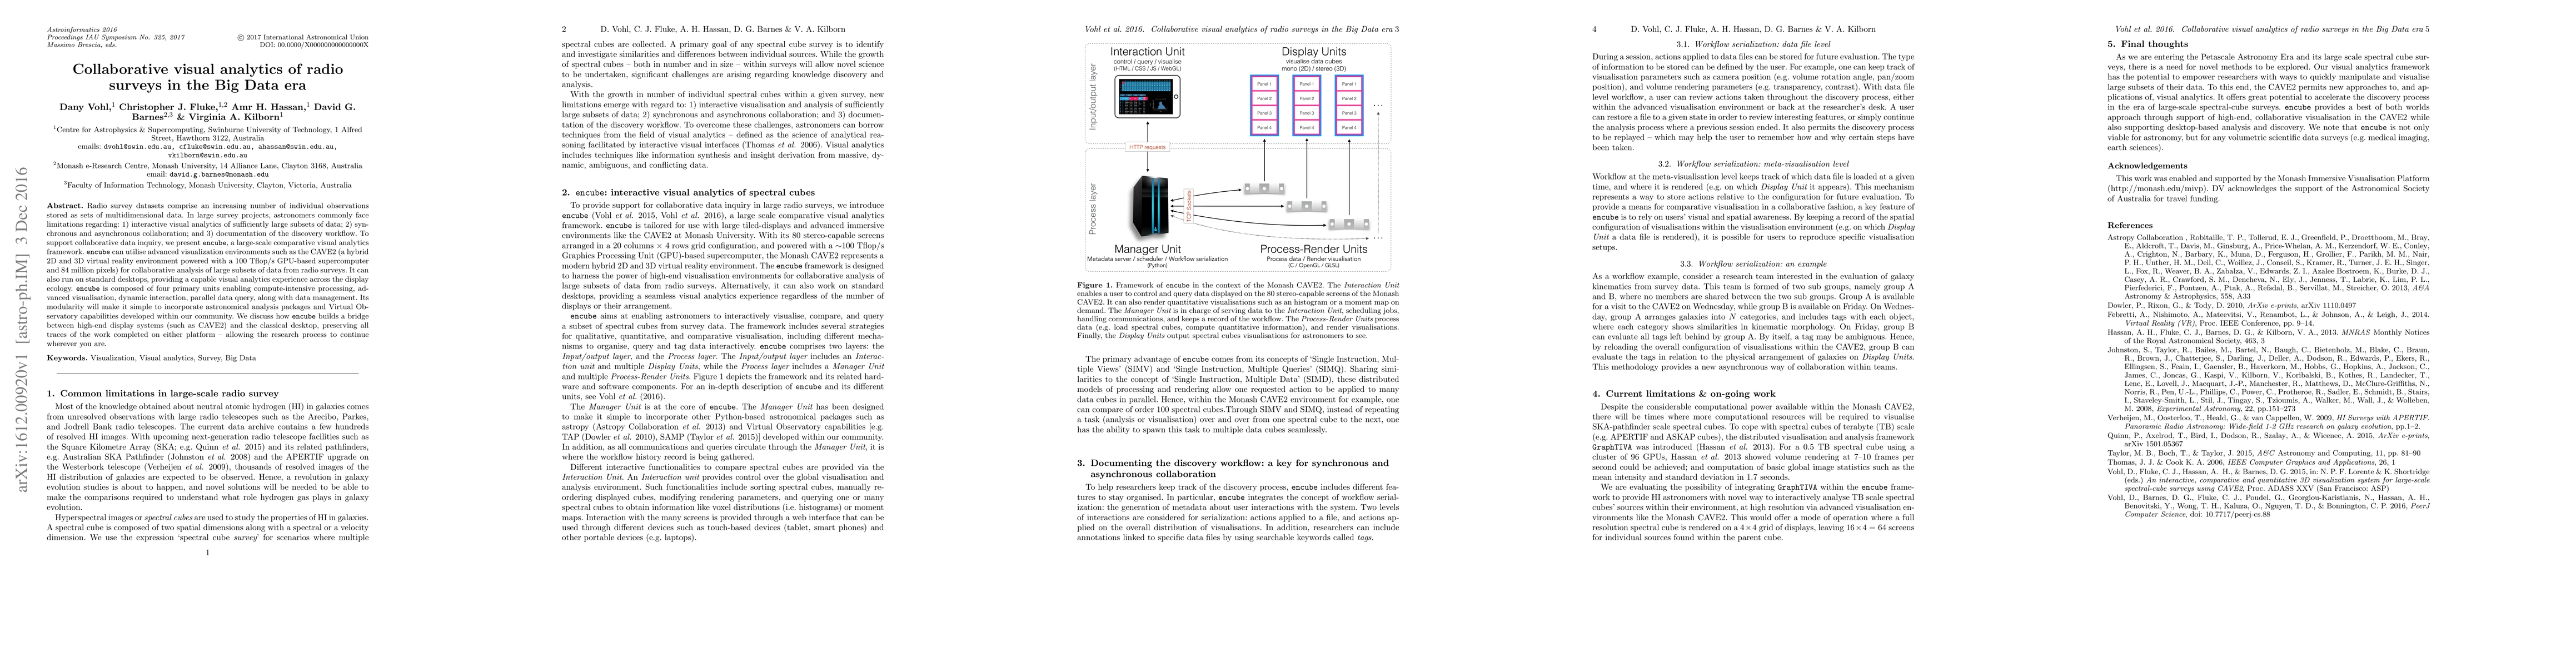
Radio survey datasets comprise an increasing number of individual observations stored as sets of multidimensional data. In large survey projects, astronomers commonly face limitations regarding: 1) interactive visual analytics of sufficiently large subsets of data; 2) synchronous and asynchronous collaboration; and 3) documentation of the discovery workflow. To support collaborative data inquiry, we present encube, a large-scale comparative visual analytics framework. Encube can utilise advanced visualization environments such as the CAVE2 (a hybrid 2D and 3D virtual reality environment powered with a 100 Tflop/s GPU-based supercomputer and 84 million pixels) for collaborative analysis of large subsets of data from radio surveys. It can also run on standard desktops, providing a capable visual analytics experience across the display ecology. Encube is composed of four primary units enabling compute-intensive processing, advanced visualisation, dynamic interaction, parallel data query, along with data management. Its modularity will make it simple to incorporate astronomical analysis packages and Virtual Observatory capabilities developed within our community. We discuss how encube builds a bridge between high-end display systems (such as CAVE2) and the classical desktop, preserving all traces of the work completed on either platform -- allowing the research process to continue wherever you are.
AI Key Findings
Get AI-generated insights about this paper's methodology, results, significance, and more — seven facets brought into focus.
Impact
Paper Details
PDF Preview
Key Terms
Citation Network
Current paper (gray), citations (green), references (blue)
Display is limited for performance on very large graphs.
Discussion 0