Color Graphs: An Efficient Model For Two-Dimensional Cellular Automata Linear Rules
Publication
Metrics
AI Quick Summary
This paper introduces a novel color graph model to represent all 512 linear rules of two-dimensional cellular automata, simplifying their analysis compared to traditional methods like rule matrices and Boolean functions. The graph theoretic properties facilitate easier examination of these linear rules.
Paper Preview
Abstract
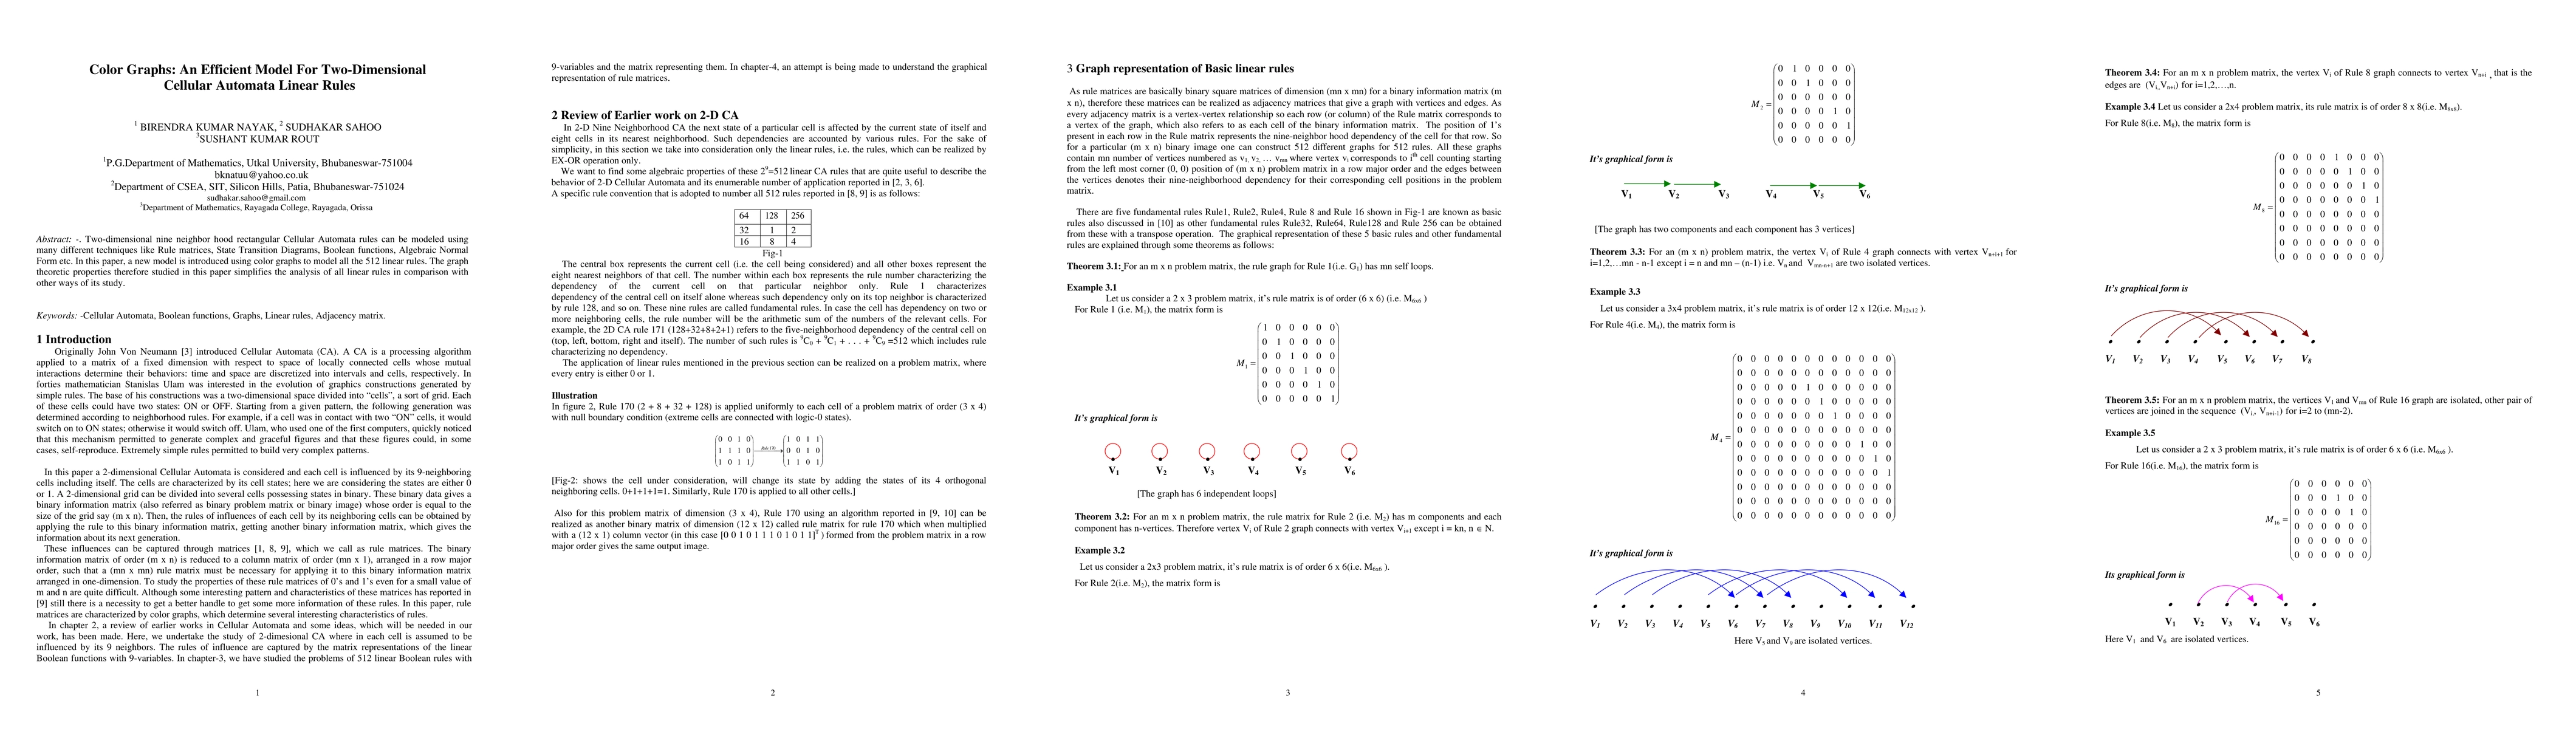
Two-dimensional nine neighbor hood rectangular Cellular Automata rules can be modeled using many different techniques like Rule matrices, State Transition Diagrams, Boolean functions, Algebraic Normal Form etc. In this paper, a new model is introduced using color graphs to model all the 512 linear rules. The graph theoretic properties therefore studied in this paper simplifies the analysis of all linear rules in comparison with other ways of its study.
AI Key Findings
Get AI-generated insights about this paper's methodology, results, significance, and more — seven facets brought into focus.
Impact
Paper Details
PDF Preview
Key Terms
Citation Network
Current paper (gray), citations (green), references (blue)
Display is limited for performance on very large graphs.
Discussion 0