Coloring black boxes: visualization of neural network decisions
Publication
Metrics
AI Quick Summary
This paper presents a method to visualize neural network decisions, transforming their 'black box' nature into understandable images. It uses projection of training vectors onto polygon vertices, aiding in learning dynamics observation, network comparison, problem identification, and confidence estimation for new samples. The approach is applicable to any continuous output 'black box' system, with illustrative examples from Wine and Satimage datasets.
Paper Preview
Abstract
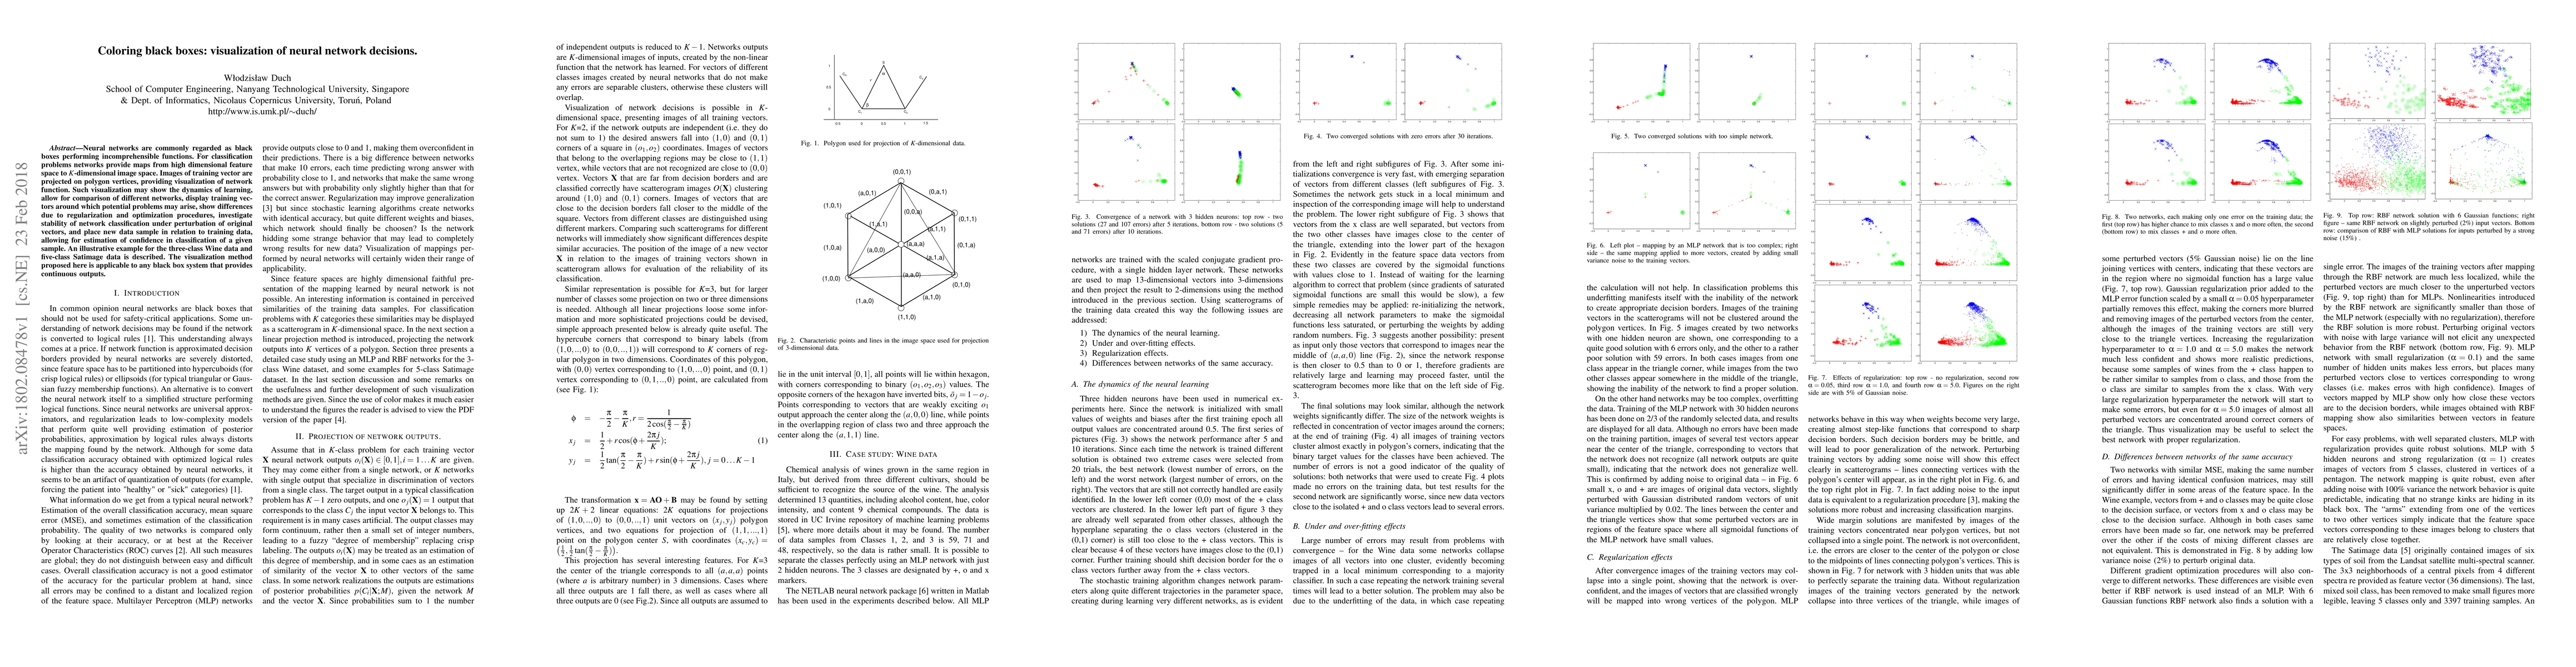
Neural networks are commonly regarded as black boxes performing incomprehensible functions. For classification problems networks provide maps from high dimensional feature space to K-dimensional image space. Images of training vector are projected on polygon vertices, providing visualization of network function. Such visualization may show the dynamics of learning, allow for comparison of different networks, display training vectors around which potential problems may arise, show differences due to regularization and optimization procedures, investigate stability of network classification under perturbation of original vectors, and place new data sample in relation to training data, allowing for estimation of confidence in classification of a given sample. An illustrative example for the three-class Wine data and five-class Satimage data is described. The visualization method proposed here is applicable to any black box system that provides continuous outputs.
AI Key Findings
Get AI-generated insights about this paper's methodology, results, significance, and more — seven facets brought into focus.
Impact
Paper Details
PDF Preview
Key Terms
Citation Network
Current paper (gray), citations (green), references (blue)
Display is limited for performance on very large graphs.
Discussion 0