Combinatorics of tableaux -- Graphical representation of insertion algorithms
Publication
Metrics
AI Quick Summary
This paper presents a graphical representation of various tableau insertion algorithms using "insertion diagrams" to clarify and categorize them, focusing on the Robinson-Schensted algorithm and Fomin's growth diagrams. The diagrams aim to elucidate relationships between different algorithms and provide a visual catalog of these processes.
Paper Preview
Abstract
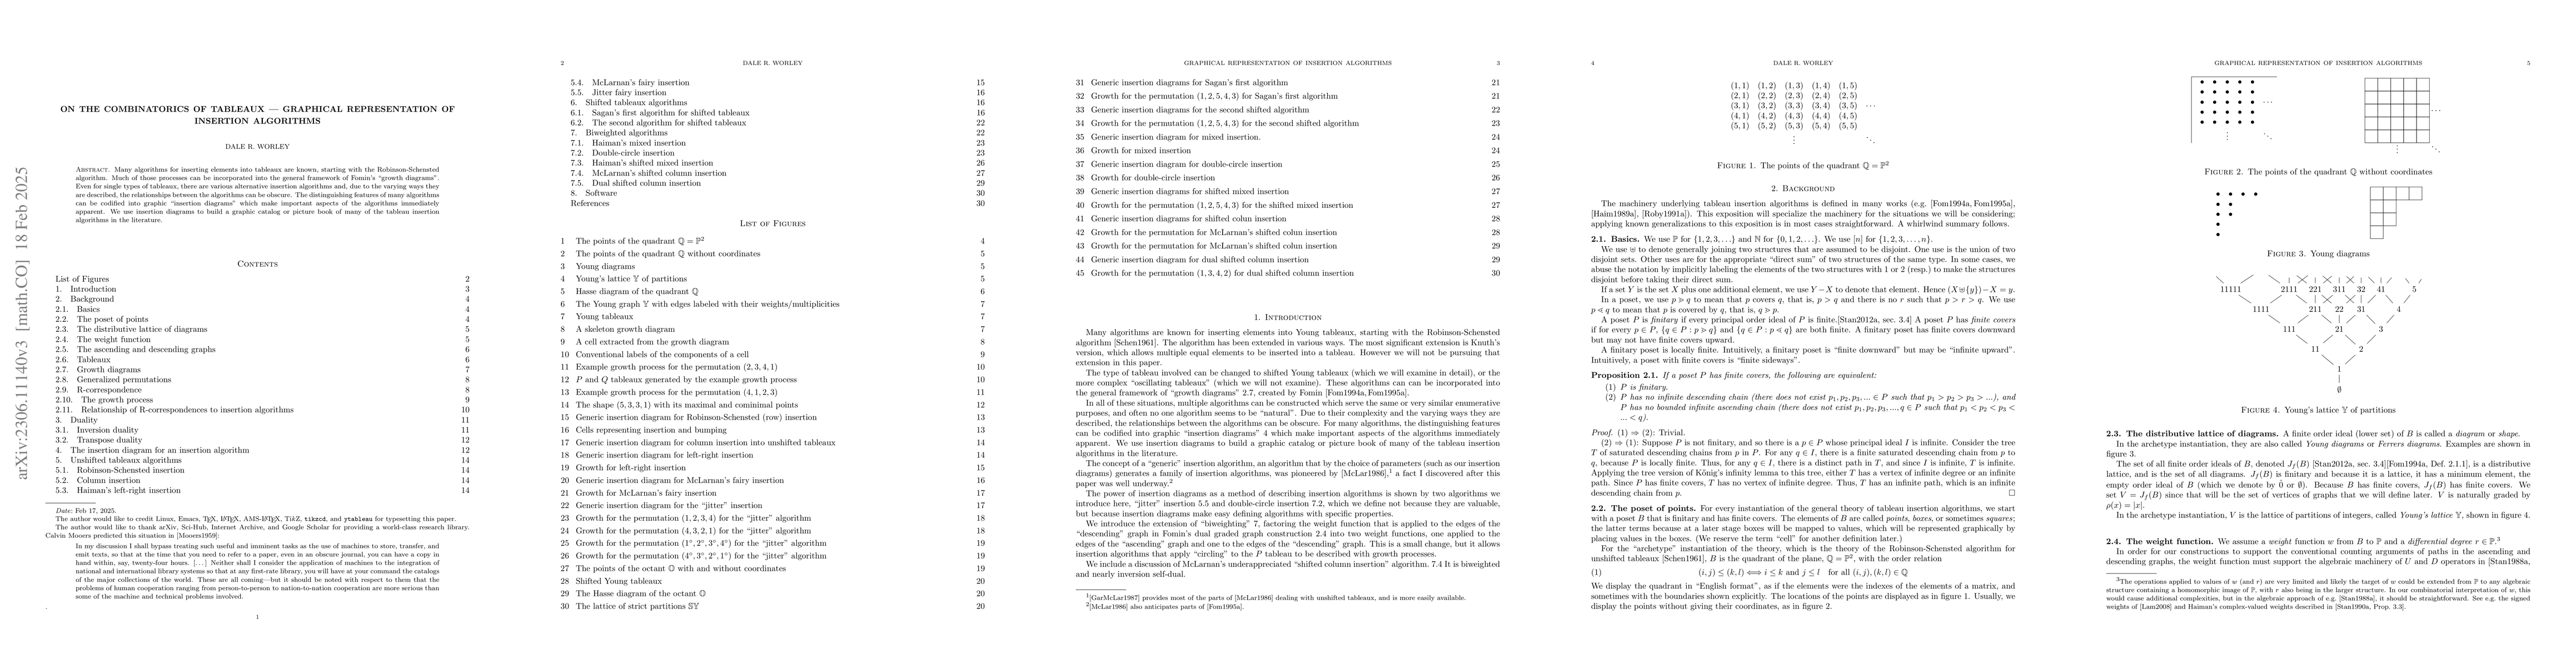
Many algorithms for inserting elements into tableaux are known, starting with the Robinson-Schensted algorithm. Much of those processes can be incorporated into the general framework of Fomin's "growth diagrams". Even for single types of tableaux, there are various alternative insertion algorithms and, due to the varying ways they are described, the relationships between the algorithms can be obscure. The distinguishing features of many algorithms can be codified into graphic "insertion diagrams" which make important aspects of the algorithms immediately apparent. We use insertion diagrams to build a graphic catalog or picture book of many of the tableau insertion algorithms in the literature.
AI Key Findings
Get AI-generated insights about this paper's methodology, results, significance, and more — seven facets brought into focus.
Impact
Paper Details
Authors
PDF Preview
Key Terms
Citation Network
Current paper (gray), citations (green), references (blue)
Display is limited for performance on very large graphs.
Discussion 0