Summary
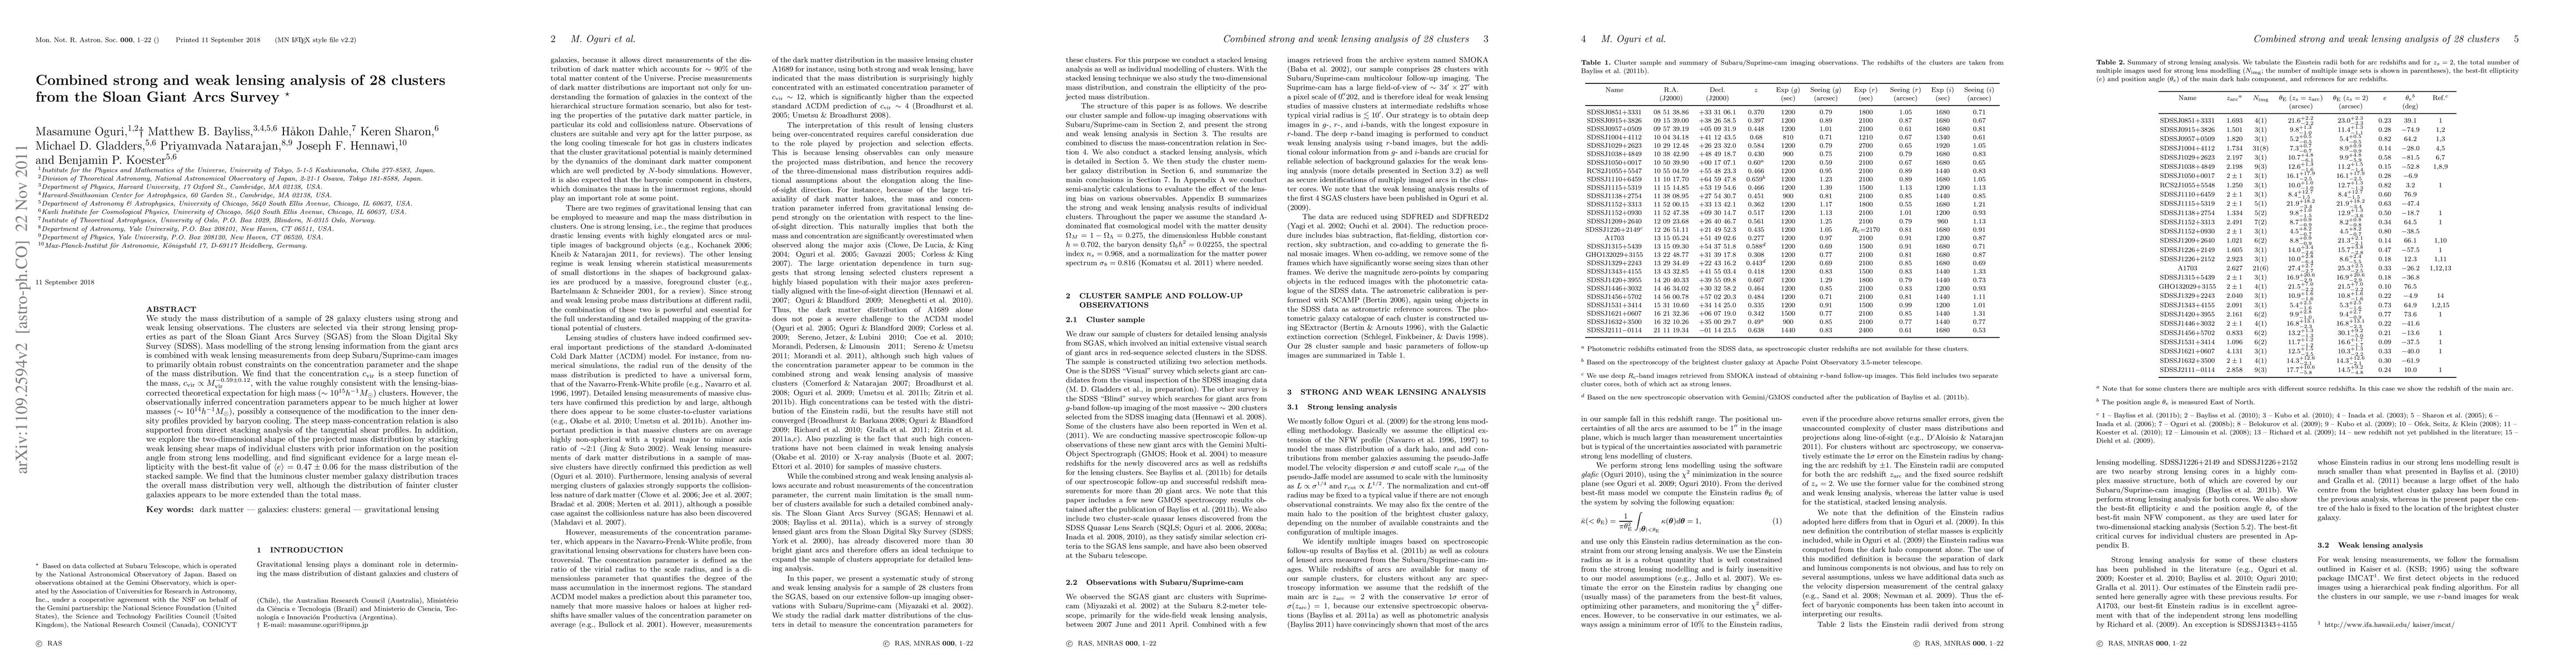
We study the mass distribution of a sample of 28 galaxy clusters using strong and weak lensing observations. The clusters are selected via their strong lensing properties as part of the Sloan Giant Arcs Survey (SGAS) from the Sloan Digital Sky Survey (SDSS). Mass modelling of the strong lensing information from the giant arcs is combined with weak lensing measurements from deep Subaru/Suprime-cam images to primarily obtain robust constraints on the concentration parameter and the shape of the mass distribution. We find that the concentration c_vir is a steep function of the mass, c_vir \propto M_vir^-0.59\pm0.12, with the value roughly consistent with the lensing-bias-corrected theoretical expectation for high mass (10^15 h^-1 M_sun) clusters. However, the observationally inferred concentration parameters appear to be much higher at lower masses (10^14 h^-1 M_sun), possibly a consequence of the modification to the inner density profiles provided by baryon cooling. The steep mass-concentration relation is also supported from direct stacking analysis of the tangential shear profiles. In addition, we explore the two-dimensional shape of the projected mass distribution by stacking weak lensing shear maps of individual clusters with prior information on the position angle from strong lens modelling, and find significant evidence for a large mean ellipticity with the best-fit value of e = 0.47 \pm 0.06 for the mass distribution of the stacked sample. We find that the luminous cluster member galaxy distribution traces the overall mass distribution very well, although the distribution of fainter cluster galaxies appears to be more extended than the total mass.
AI Key Findings
Get AI-generated insights about this paper's methodology, results, and significance.
Paper Details
PDF Preview
Key Terms
Citation Network
Current paper (gray), citations (green), references (blue)
Display is limited for performance on very large graphs.
Similar Papers
Found 4 papers| Title | Authors | Year | Actions |
|---|
Comments (0)