Comment on "The phase diagram of the multi-matrix model with ABAB-interaction from functional renormalization"
Publication
Metrics
AI Quick Summary
Researchers comment on a phase diagram in a complex mathematical model, highlighting a discrepancy with established methods and proposing an alternative approach to reproduce the results.
Paper Preview
Abstract
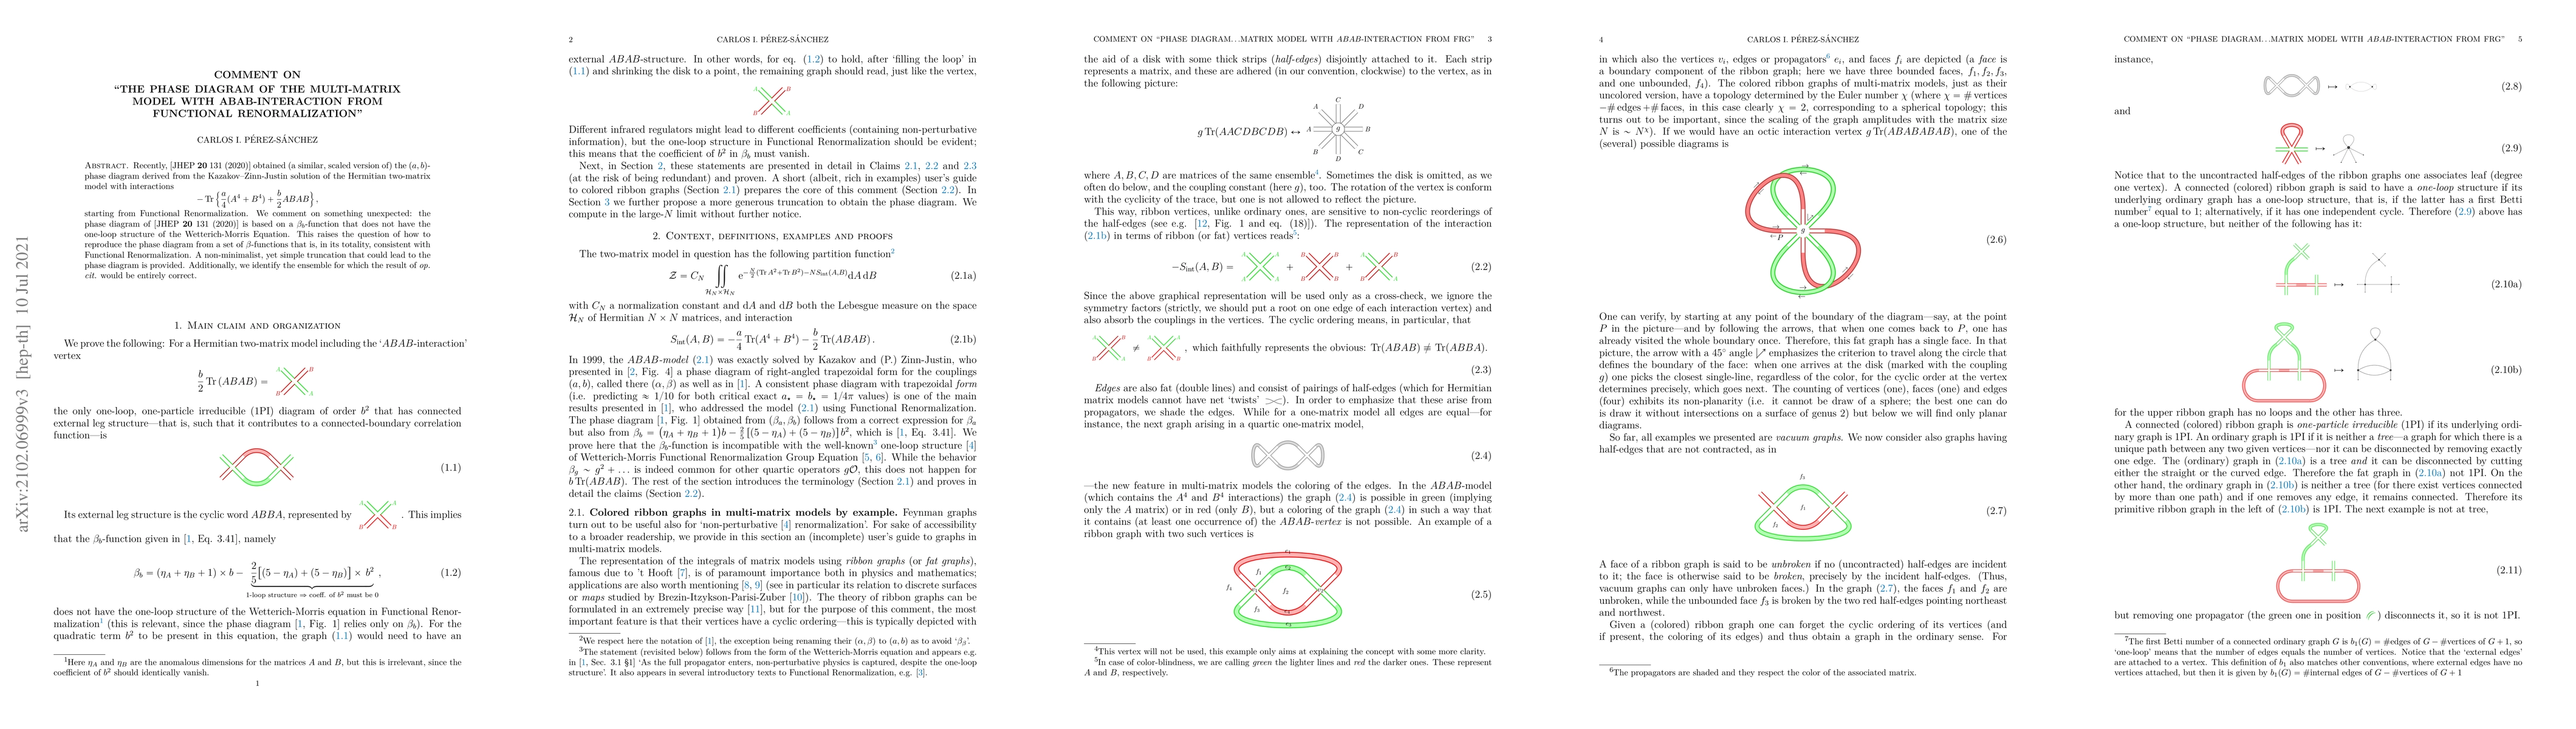
Recently, [JHEP 20 131 (2020)] obtained (a similar, scaled version of) the ($a,b$)-phase diagram derived from the Kazakov--Zinn-Justin solution of the Hermitian two-matrix model with interactions \[\mathrm{Tr\,}\Big\{\frac{a}{4} (A^4+B^4)+\frac{b}{2} ABAB\Big\}\,,\] starting from Functional Renormalization. We comment on something unexpected: the phase diagram of [JHEP 20 131 (2020)] is based on a $\beta_b$-function that does not have the one-loop structure of the Wetterich-Morris Equation. This raises the question of how to reproduce the phase diagram from a set of $\beta$-functions that is, in its totality, consistent with Functional Renormalization. A non-minimalist, yet simple truncation that could lead to the phase diagram is provided. Additionally, we identify the ensemble for which the result of op. cit. would be entirely correct.
AI Key Findings
Get AI-generated insights about this paper's methodology, results, significance, and more — seven facets brought into focus.
Impact
Paper Details
PDF Preview
Key Terms
Citation Network
Current paper (gray), citations (green), references (blue)
Display is limited for performance on very large graphs.
Discussion 0