Publication
Metrics
AI Quick Summary
This study reveals that the time intervals between consecutive trades for thirty U.S. stocks across eight sectors exhibit a universal scaling pattern, characterized by a Weibull distribution and power-law correlations. The findings suggest a common mechanism governing trading dynamics, with implications for price formation processes.
Paper Preview
Abstract
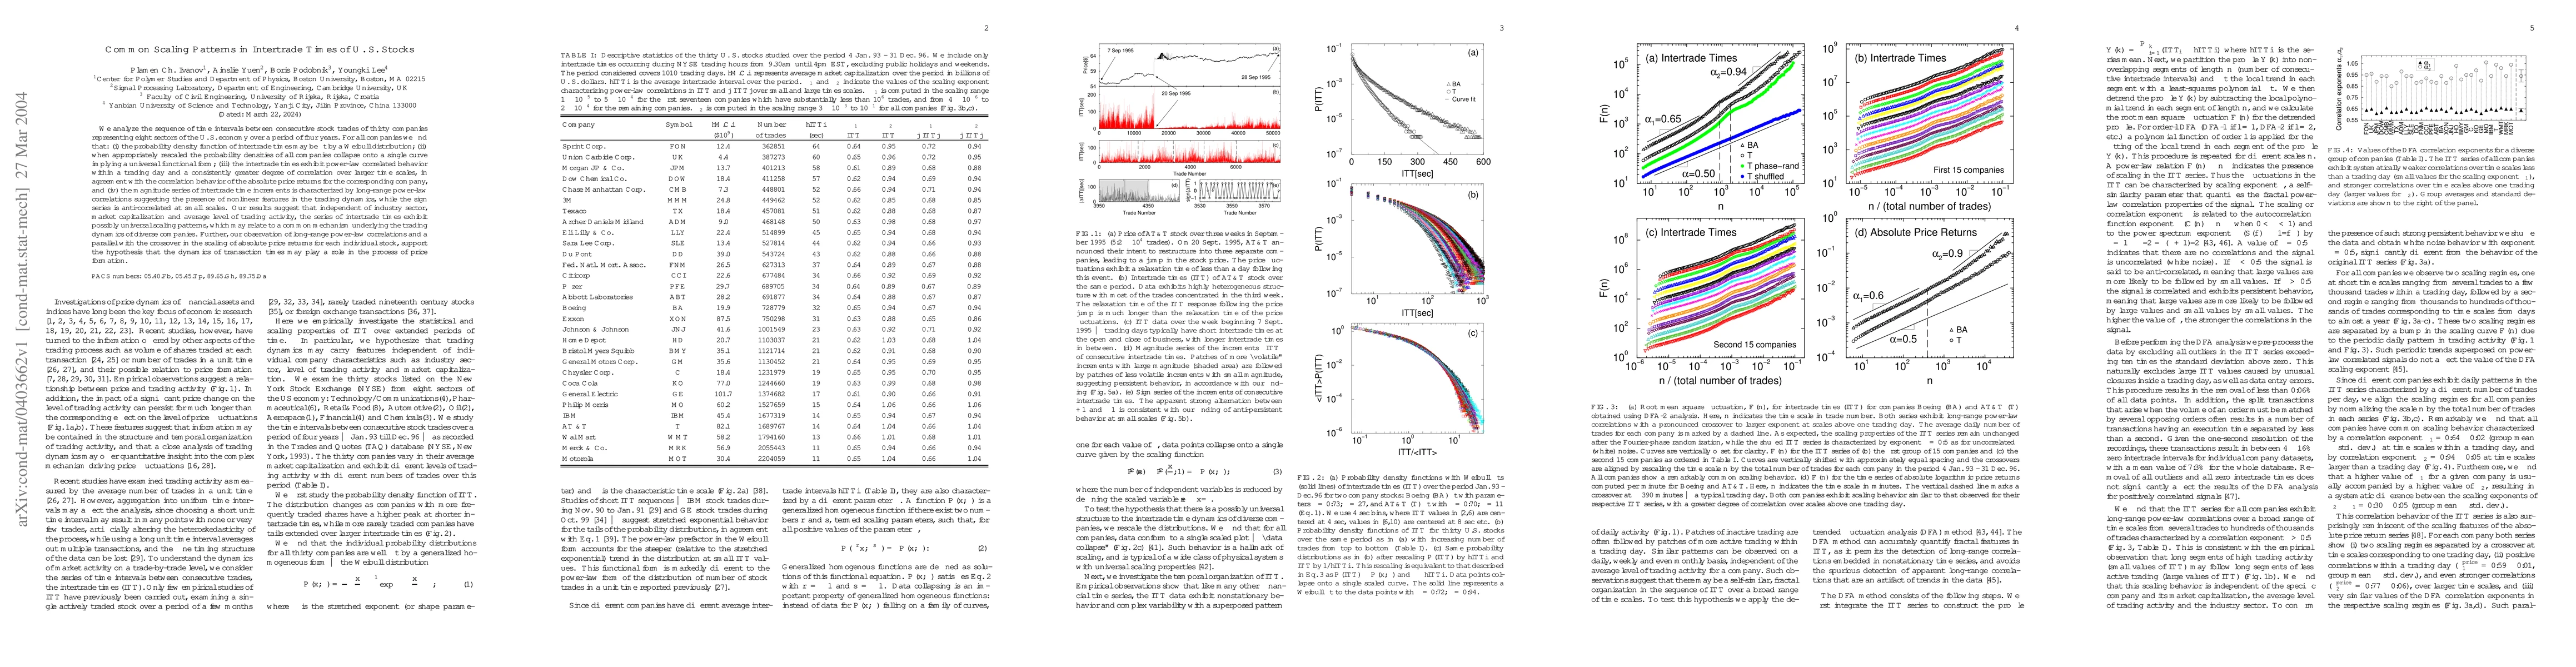
We analyze the sequence of time intervals between consecutive stock trades of thirty companies representing eight sectors of the U. S. economy over a period of four years. For all companies we find that: (i) the probability density function of intertrade times may be fit by a Weibull distribution; (ii) when appropriately rescaled the probability densities of all companies collapse onto a single curve implying a universal functional form; (iii) the intertrade times exhibit power-law correlated behavior within a trading day and a consistently greater degree of correlation over larger time scales, in agreement with the correlation behavior of the absolute price returns for the corresponding company, and (iv) the magnitude series of intertrade time increments is characterized by long-range power-law correlations suggesting the presence of nonlinear features in the trading dynamics, while the sign series is anti-correlated at small scales. Our results suggest that independent of industry sector, market capitalization and average level of trading activity, the series of intertrade times exhibit possibly universal scaling patterns, which may relate to a common mechanism underlying the trading dynamics of diverse companies. Further, our observation of long-range power-law correlations and a parallel with the crossover in the scaling of absolute price returns for each individual stock, support the hypothesis that the dynamics of transaction times may play a role in the process of price formation.
AI Key Findings
Get AI-generated insights about this paper's methodology, results, significance, and more — seven facets brought into focus.
Impact
Paper Details
PDF Preview
Citation Network
Current paper (gray), citations (green), references (blue)
Display is limited for performance on very large graphs.
Discussion 0