Quick Summary:

This paper explores the complexities of designing patient health data visualizations for clinical discussions, framing it as a "wicked problem" due to the diverse needs of patients, providers, and healthcare systems. The authors outline their research methodologies and insights from an exploratory design process, urging designers to consider individual differences when creating these visualizations.

Summary

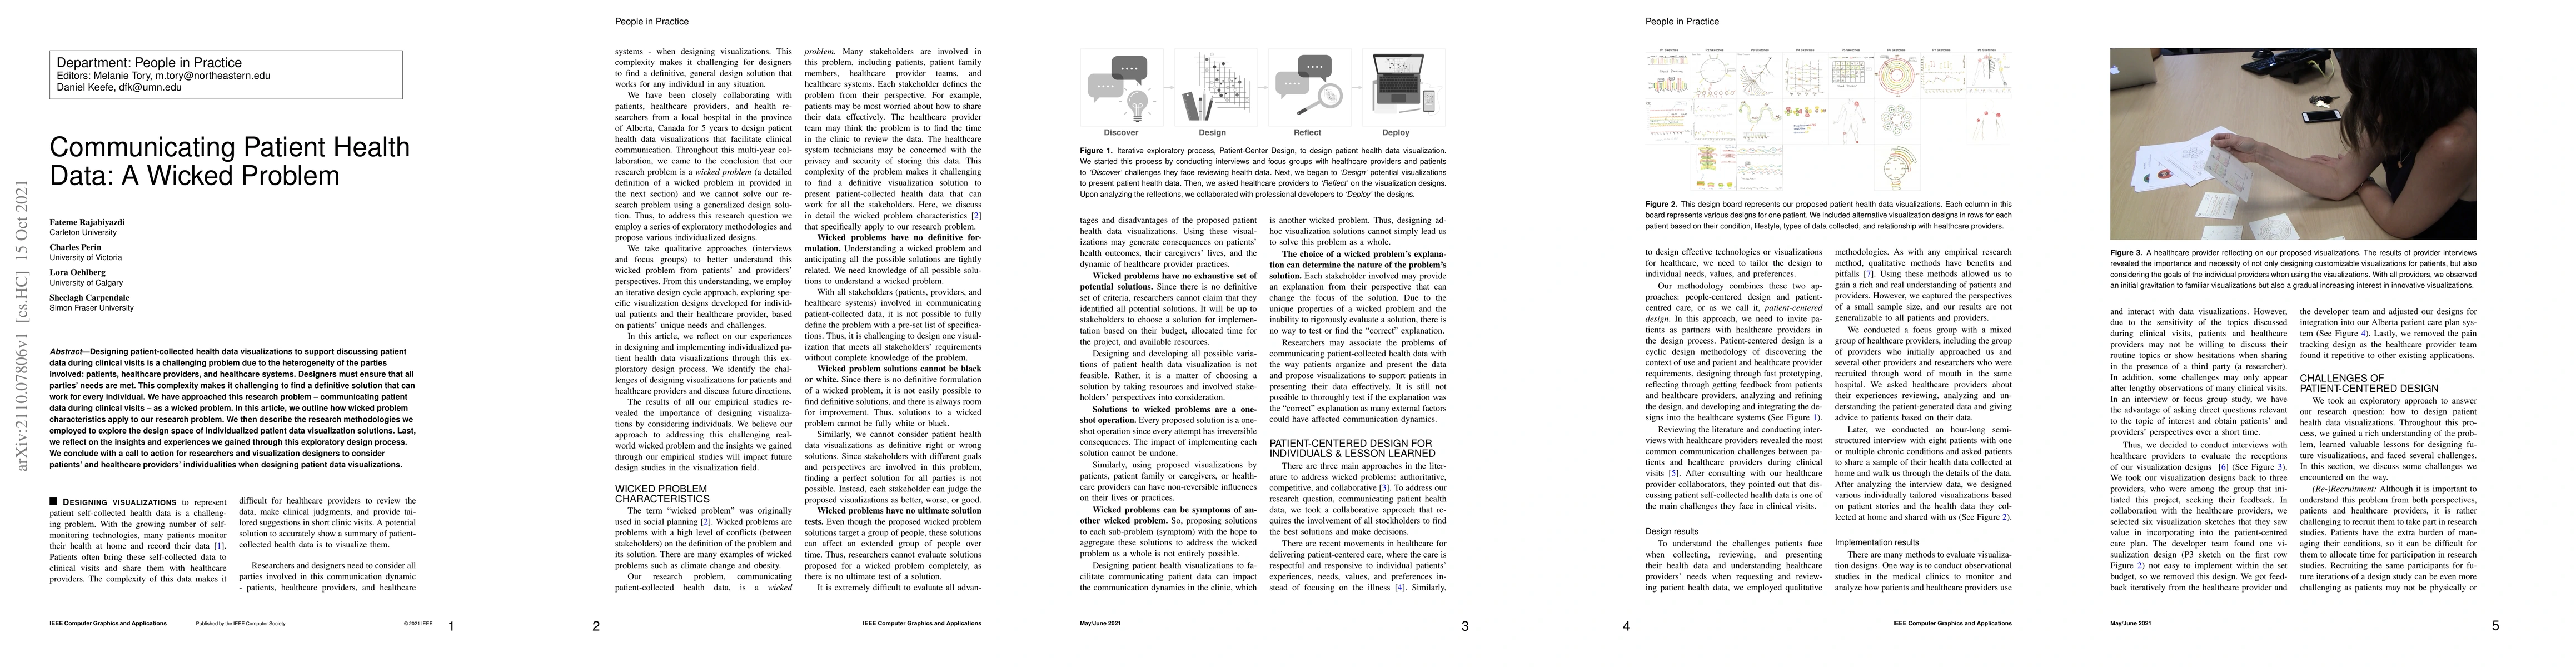
Designing patient-collected health data visualizations to support discussing patient data during clinical visits is a challenging problem due to the heterogeneity of the parties involved: patients, healthcare providers, and healthcare systems. Designers must ensure that all parties' needs are met. This complexity makes it challenging to find a definitive solution that can work for every individual. We have approached this research problem -- communicating patient data during clinical visits -- as a wicked problem. In this article, we outline how wicked problem characteristics apply to our research problem. We then describe the research methodologies we employed to explore the design space of individualized patient data visualization solutions. Last, we reflect on the insights and experiences we gained through this exploratory design process. We conclude with a call to action for researchers and visualization designers to consider patients' and healthcare providers' individualities when designing patient data visualizations.

AI Key Findings

Get AI-generated insights about this paper's methodology, results, and significance.

Paper Details

PDF Preview

Download PDF

Key Terms

patient (0.405)
patient (0.358)
healthcare (0.321)
healthcare (0.293)
providers (0.259)
patients (0.246)
clinical (0.245)
designing (0.243)
visualization (0.240)
patients (0.238)
clinical (0.217)
designing (0.217)
research (0.198)
problem (0.191)
research (0.188)
challenging (0.178)
problem (0.172)
challenging (0.164)
data (0.160)
reflect (0.158)
Title Authors Year Actions
AI-Enabled Conversational Journaling for Advancing Parkinson's Disease Symptom Tracking
Mashrur Rashik, Shilpa Sweth, Nishtha Agrawal, Saiyyam Kochar, Kara M Smith, Fateme Rajabiyazdi, V. Setlur, Narges Mahyar, Ali Sarvghad
2025
View Paper
Practical Challenges of Progressive Data Science in Healthcare
Faisal Zaki Roshan, Abhishek Ahuja, Fateme Rajabiyazdi
2024
View Paper
Designing and Developing a Mobile Application for Monitoring & Visualizing Blood Pressure Data
Mahsa Sinaei Hamed, Laura Reid, Alice Olorunnife, David Casciano, Fateme Rajabiyazdi
2023
View Paper
Performance Evaluation of LoRa 915 MHz for Health Monitoring with Adaptive Data Rate
Puput Dani Prasetyo Adi, Abdul Wahid, Agoestina Mappadang, Asworoningrum Yulindahwati, Yudi Prastiyono, Imam Tahyudin, La Sinaini, S. Sujak, N. Nurindah
2022
View Paper
Creative Visualisation Opportunities Workshops: A Case Study in Population Health
Mai Elshehaly, Kuldeep Sohal, T. Lawton, M. Bryant, M. Mon-Williams
2022
View Paper
Visualising Emergency Department Wait Times; Rapid Iterative Testing to Determine Patient Preferences for Displays
K. Walker, E. Potter, I. Hwang, T. Dwyer, D. Egerton-Warburton, K. Joe, J. Hutton, S. Freeman, D. Flynn
2022
View Paper
Integrating Prescriptions into Calendars: Design Considerations
Maybin Lengwe, †. JensWeber, Charles Perin
2023
View Paper
Visualizing recovery progress for patients after a stroke
2022
View Paper
Visualising Emergency Department Wait Times; Rapid Iterative Testing to Determine Patient Preferences for Displays
2022
View Paper
Visualising Emergency Department Wait Times; Rapid Iterative Testing to Determine Patient Preferences for Displays
2022
View Paper
Visualising Emergency Department Wait Times; Rapid Iterative Testing to Determine Patient Preferences for Displays
2022
View Paper
Visualising Emergency Department Wait Times; Rapid Iterative Testing to Determine Patient Preferences for Displays
2022
View Paper

Comments (0)

This website uses cookies to ensure you get the best experience. Learn more