Quick Summary:

This paper argues that communicative visualizations suffer from a mismatch between design intent and evaluation methods, proposing a learning-based framework where designers view recipients as students. This approach allows for better definition, assessment, and comparison of visualizations, as illustrated through a survey and interviews with the Data Visualization Society.

Summary

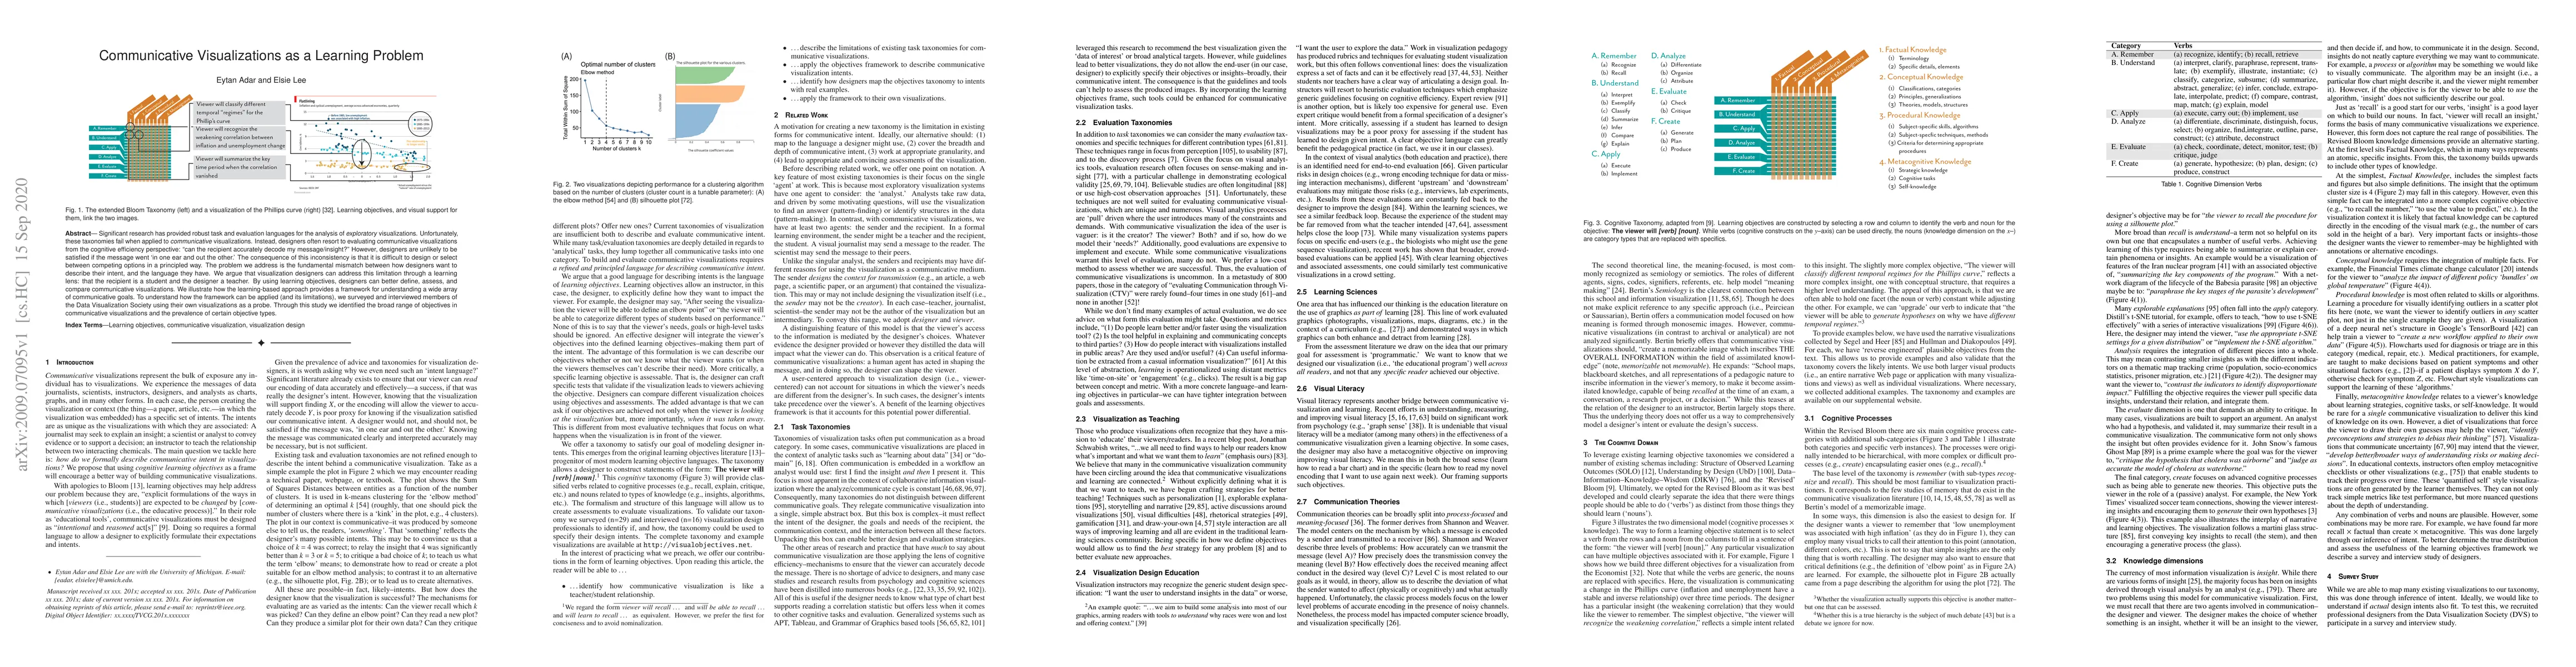
Significant research has provided robust task and evaluation languages for the analysis of exploratory visualizations. Unfortunately, these taxonomies fail when applied to communicative visualizations. Instead, designers often resort to evaluating communicative visualizations from the cognitive efficiency perspective: "can the recipient accurately decode my message/insight?" However, designers are unlikely to be satisfied if the message went 'in one ear and out the other.' The consequence of this inconsistency is that it is difficult to design or select between competing options in a principled way. The problem we address is the fundamental mismatch between how designers want to describe their intent, and the language they have. We argue that visualization designers can address this limitation through a learning lens: that the recipient is a student and the designer a teacher. By using learning objectives, designers can better define, assess, and compare communicative visualizations. We illustrate how the learning-based approach provides a framework for understanding a wide array of communicative goals. To understand how the framework can be applied (and its limitations), we surveyed and interviewed members of the Data Visualization Society using their own visualizations as a probe. Through this study we identified the broad range of objectives in communicative visualizations and the prevalence of certain objective types.

AI Key Findings

Get AI-generated insights about this paper's methodology, results, and significance.

Paper Details

PDF Preview

Download PDF

Key Terms

message (0.250)
objectives (0.237)
address (0.166)
learning (0.163)
teacher (0.156)
members (0.153)
cognitive (0.152)
unfortunately (0.150)
options (0.150)
applied (0.150)
competing (0.148)
goals (0.148)
lens (0.145)
limitation (0.144)
satisfied (0.142)
student (0.141)
based approach (0.140)
fail (0.135)
languages (0.135)
select (0.135)

Citation Network

Current paper (gray), citations (green), references (blue)

Current Paper
Citations
References
Click to view

Similar Papers

Found 4 papers
Title Authors Year Actions
Double Tap for This Post: Understanding the Communication of Data Visualization on Social Media
Yang Shi, Yechun Peng, Jieying Ding, Xingyu Lan, Nan Cao
2025
View Paper
VisQuestions: Constructing Evaluations for Communicative Visualizations
Ruijia Guan, Elsie Lee-Robbins, Xu Wang, Eytan Adar
2025
View Paper
"Piecing Data Connections Together Like a Puzzle": Effects of Increasing Task Complexity on the Effectiveness of Data Storytelling Enhanced Visualisations
M. Milesi, Paola Mejia-Domenzain, Laura Brandl, Vanessa Echeverría, Yueqiao Jin, D. Gašević, Yi-Shan Tsai, Tanja Käser, Roberto Martínez-Maldonado
2025
View Paper
Entanglements for Visualization: Changing Research Outcomes through Feminist Theory
Derya Akbaba, Lauren Klein, Miriah Meyer
2024
View Paper
Mind Drifts, Data Shifts: Utilizing Mind Wandering to Track the Evolution of User Experience with Data Visualizations
Anjana Arunkumar, Lace Padilla, Chris Bryan
2024
View Paper
A Practical Guide to Participatory Design Sessions for the Development of Information Visualizations: Tutorial
Adriana Arcia, S. Stonbraker, Sabrina Mangal, Maichou Lor
2024
View Paper
Do You See What I See? A Qualitative Study Eliciting High-Level Visualization Comprehension
Ghulam Jilani Quadri, Arran Zeyu Wang, Zhehao Wang, Jennifer Adorno, Paul Rosen, D. Szafir
2024
View Paper
Advancing the science of visualization of health data for lay audiences
Adriana Arcia, Natalie C. Benda, Danny T. Y. Wu
2024
View Paper
An empirical study of counterfactual visualization to support visual causal inference
Arran Zeyu Wang, D. Borland, David Gotz
2024
View Paper
Who is the Audience? Designing Casual Data Visualizations for the 'General Public'
Regina Schuster, Laura Koesten, T. Möller, Kathleen Gregory
2023
View Paper
VisActs: Describing Intent in Communicative Visualization
Keshav Dasu, Yun-Hsin Kuo, Kwan-Liu Ma
2023
View Paper
Image or Information? Examining the Nature and Impact of Visualization Perceptual Classification
Anjana Arunkumar, Lace M. K. Padilla, Gi-Yeul Bae, Chris Bryan
2023
View Paper
Do you want to promote recall, perceptions, or behavior? The best data visualization depends on the communication goal
J. Ancker, Natalie C. Benda, B. Zikmund‐Fisher
2023
View Paper
Seeing things the same way: perspectives and lessons learned from research-design collaborations
Sabrina Mangal, Lauren Berger, J. Bruzzese, Alexandra de la Cruz, Maichou Lor, Imama A Naqvi, Eugenio Solis de Ovando, Nicole Spiegel-Gotsch, S. Stonbraker, Adriana Arcia
2023
View Paper
Election predictions in the news: how users perceive and respond to visual election forecasts
Benedict Witzenberger, N. Diakopoulos
2023
View Paper
From Artifacts to Outcomes: Comparison of HMD VR, Desktop, and Slides Lectures for Food Microbiology Laboratory Instruction
Fei Xue, Rongchen Guo, Siyuan Yao, Luxin Wang, Kwan-Liu Ma
2023
View Paper
What is the message? Perspectives on Visual Data Communication
Laura Koesten, Kathleen Gregory, Regina Schuster, Christian Knoll, Sarah Davies, T. Möller
2023
View Paper
From Invisible to Visible: Impacts of Metadata in Communicative Data Visualization
Alyxander Burns, C. Lee, Thai On, Cindy Xiong, Evan M. Peck, Narges Mahyar
2022
View Paper
“Being Simple on Complex Issues” – Accounts on Visual Data Communication About Climate Change
Regina Schuster, Kathleen Gregory, T. Möller, Laura Koesten
2022
View Paper
How Personality and Visual Channels Affect Insight Generation
Tomás Alves, Carlota Dias, D. Gonçalves, S. Gama, J. Henriques-Calado
2022
View Paper
Affective Learning Objectives for Communicative Visualizations
Elsie Lee-Robbins, Eytan Adar
2022
View Paper
Roboviz: A Game-Centered Project for Information Visualization Education
Eytan Adar, Elsie Lee-Robbins
2022
View Paper
Characterizing Grounded Theory Approaches in Visualization
A. Diehl, Alfie Abdul-Rahman, B. Bach, Mennatallah El-Assady, Matthias Kraus, R. Laramee, Min Chen University of Zurich, Switzerland., King’s College London, Uk, Edinburgh University, Eth AI Center, Zurich, University of Konstanz, Germany, Nottingham University, U. Oxford
2022
View Paper
Accessible Visualization via Natural Language Descriptions: A Four-Level Model of Semantic Content
Alan Lundgard, Arvind Satyanarayan
2021
View Paper
Learning Objectives, Insights, and Assessments: How Specification Formats Impact Design
Elsie Lee-Robbins, Shiqing He, Eytan Adar
2021
View Paper
Explanatory Journeys: Visualising to Understand and Explain Administrative Justice Paths of Redress
Jonathan C. Roberts, P. Butcher, Ann Sherlock, S. Nason
2021
View Paper
Co-adaptive visual data analysis and guidance processes
F. Sperrle, A. Jeitler, J. Bernard, D. Keim, Mennatallah El-Assady
2021
View Paper
Designing With Pictographs: Envision Topics Without Sacrificing Understanding
Alyxander Burns, Cindy Xiong, S. Franconeri, A. Cairo, Narges Mahyar
2021
View Paper
What are Table Cartograms Good for Anyway? An Algebraic Analysis
A. Mcnutt
2021
View Paper
Viral Visualizations: How Coronavirus Skeptics Use Orthodox Data Practices to Promote Unorthodox Science Online
Crystal Lee, Tanya Yang, Gabrielle Inchoco, Graham M. Jones, Arvind Satyanarayan
2021
View Paper
A Learning Approach for Increasing AI Literacy via XAI in Informal Settings
Mira Sneirson, Josephine Chai, Iris Howley
2024
View Paper
Mapping the Landscape of Data Visualizations in Schools and Educational Resources
Magdalena Boucher, Christina Stoiber, Magdaléna Kejstová, Martin Kandlhofer, Alena Ertl, Simone Kriglstein, Wolfgang Aigner
2024
View Paper
Evaluating Bloom’s Taxonomy-based Learning Modules for Parallel Coordinates Literacy
Ilena Peng, Elif E. Firat, R. Laramee, Alark Joshi
2022
View Paper
Tell It Slant: Investigating the Engagement, Discourse, and Popularity of Data Visualization in Online Communities
Emma Baker
2022
View Paper

Comments (0)

This website uses cookies to ensure you get the best experience. Learn more