Community Time-Activity Trajectory Modelling based on Markov Chain Simulation and Dirichlet Regression
Publication
Metrics
AI Quick Summary
This paper develops a community time-activity trajectory model using Markov Chains and Dirichlet Regression to account for both social-demographic and built environment factors. The model, validated on New York data, shows significant impacts of diversity, median age, transportation conditions, and residential density on activity patterns.
Paper Preview
Abstract
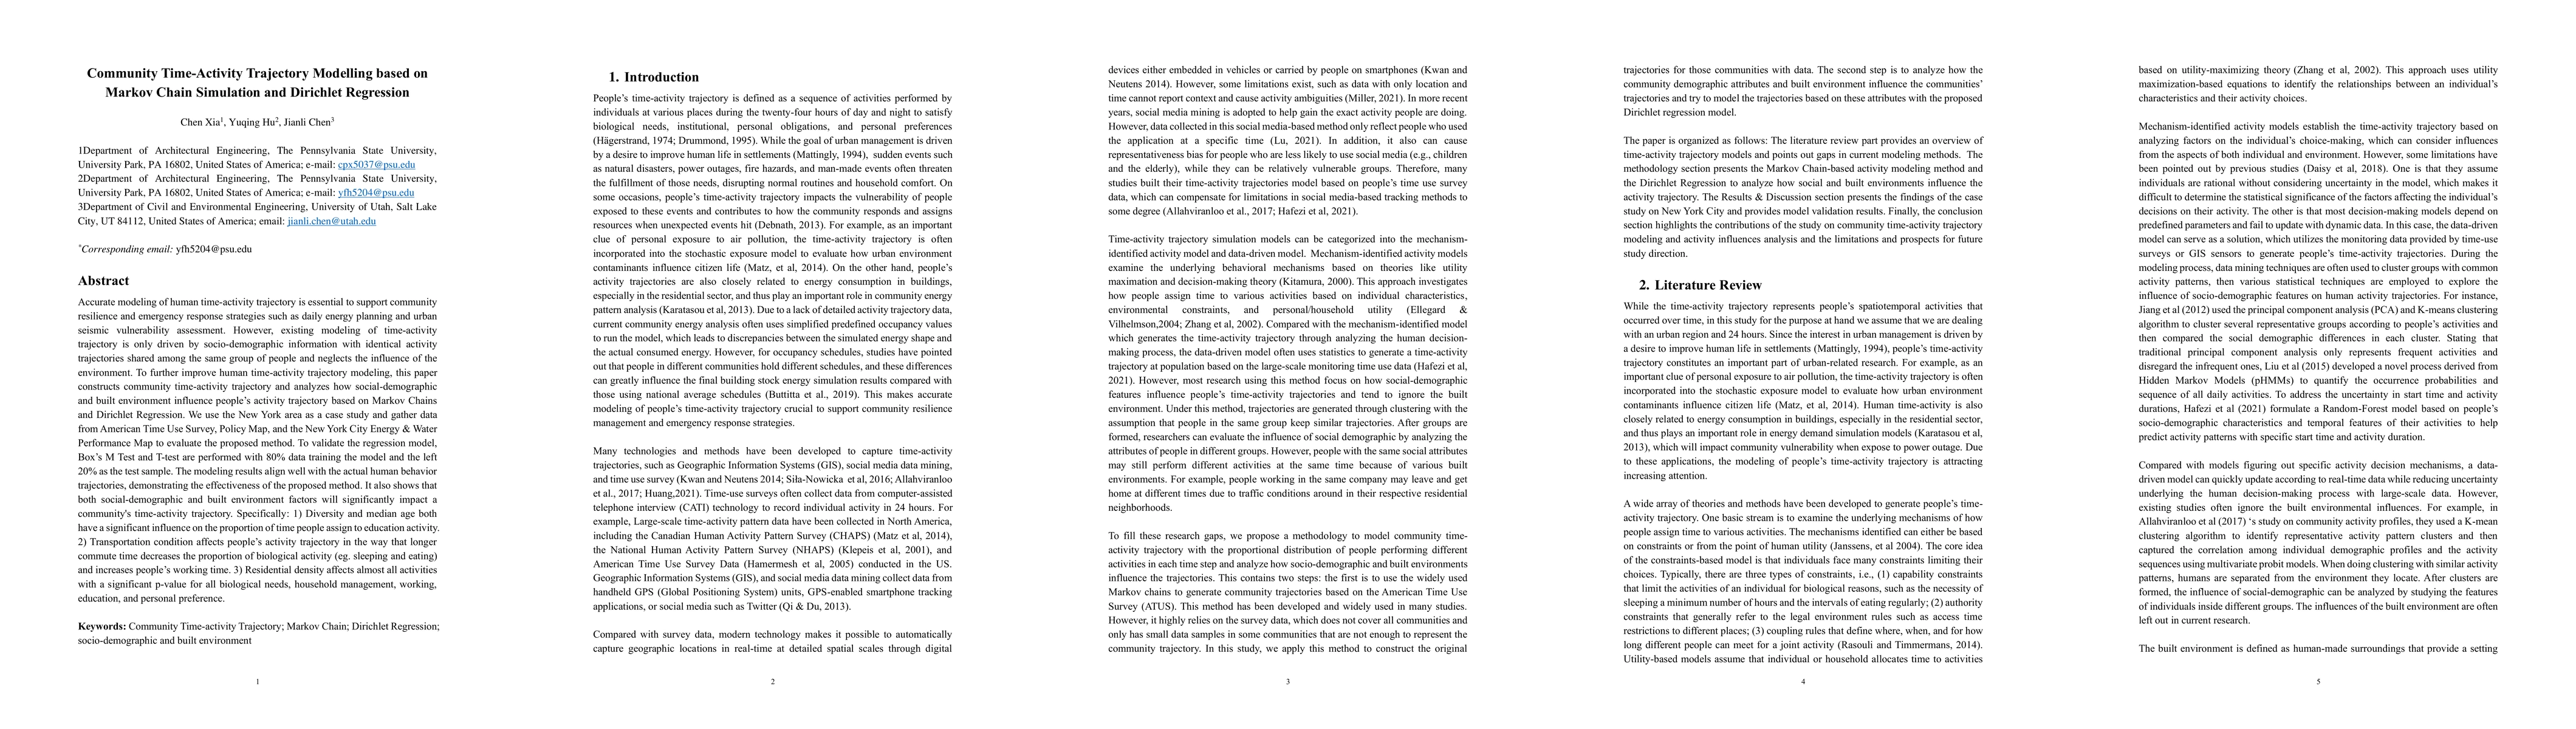
Accurate modeling of human time-activity trajectory is essential to support community resilience and emergency response strategies such as daily energy planning and urban seismic vulnerability assessment. However, existing modeling of time-activity trajectory is only driven by socio-demographic information with identical activity trajectories shared among the same group of people and neglects the influence of the environment. To further improve human time-activity trajectory modeling, this paper constructs community time-activity trajectory and analyzes how social-demographic and built environment influence people s activity trajectory based on Markov Chains and Dirichlet Regression. We use the New York area as a case study and gather data from American Time Use Survey, Policy Map, and the New York City Energy & Water Performance Map to evaluate the proposed method. To validate the regression model, Box s M Test and T-test are performed with 80% data training the model and the left 20% as the test sample. The modeling results align well with the actual human behavior trajectories, demonstrating the effectiveness of the proposed method. It also shows that both social-demographic and built environment factors will significantly impact a community's time-activity trajectory. Specifically, 1) Diversity and median age both have a significant influence on the proportion of time people assign to education activity. 2) Transportation condition affects people s activity trajectory in the way that longer commute time decreases the proportion of biological activity (eg. sleeping and eating) and increases people s working time. 3) Residential density affects almost all activities with a significant p-value for all biological needs, household management, working, education, and personal preference.
AI Key Findings
Get AI-generated insights about this paper's methodology, results, significance, and more — seven facets brought into focus.
Impact
Paper Details
Authors
PDF Preview
Key Terms
Citation Network
Current paper (gray), citations (green), references (blue)
Display is limited for performance on very large graphs.
Discussion 0