Compact Phase Histograms for Guided Exploration of Periodicity
Publication
Metrics
AI Quick Summary
This paper proposes a compact visual representation using phase histograms to explore periodicity in time-dependent datasets. The method suggests alternative period lengths based on quality measures, facilitating guided, interactive analysis and linking to other visualizations for comprehensive exploration.
Paper Preview
Abstract
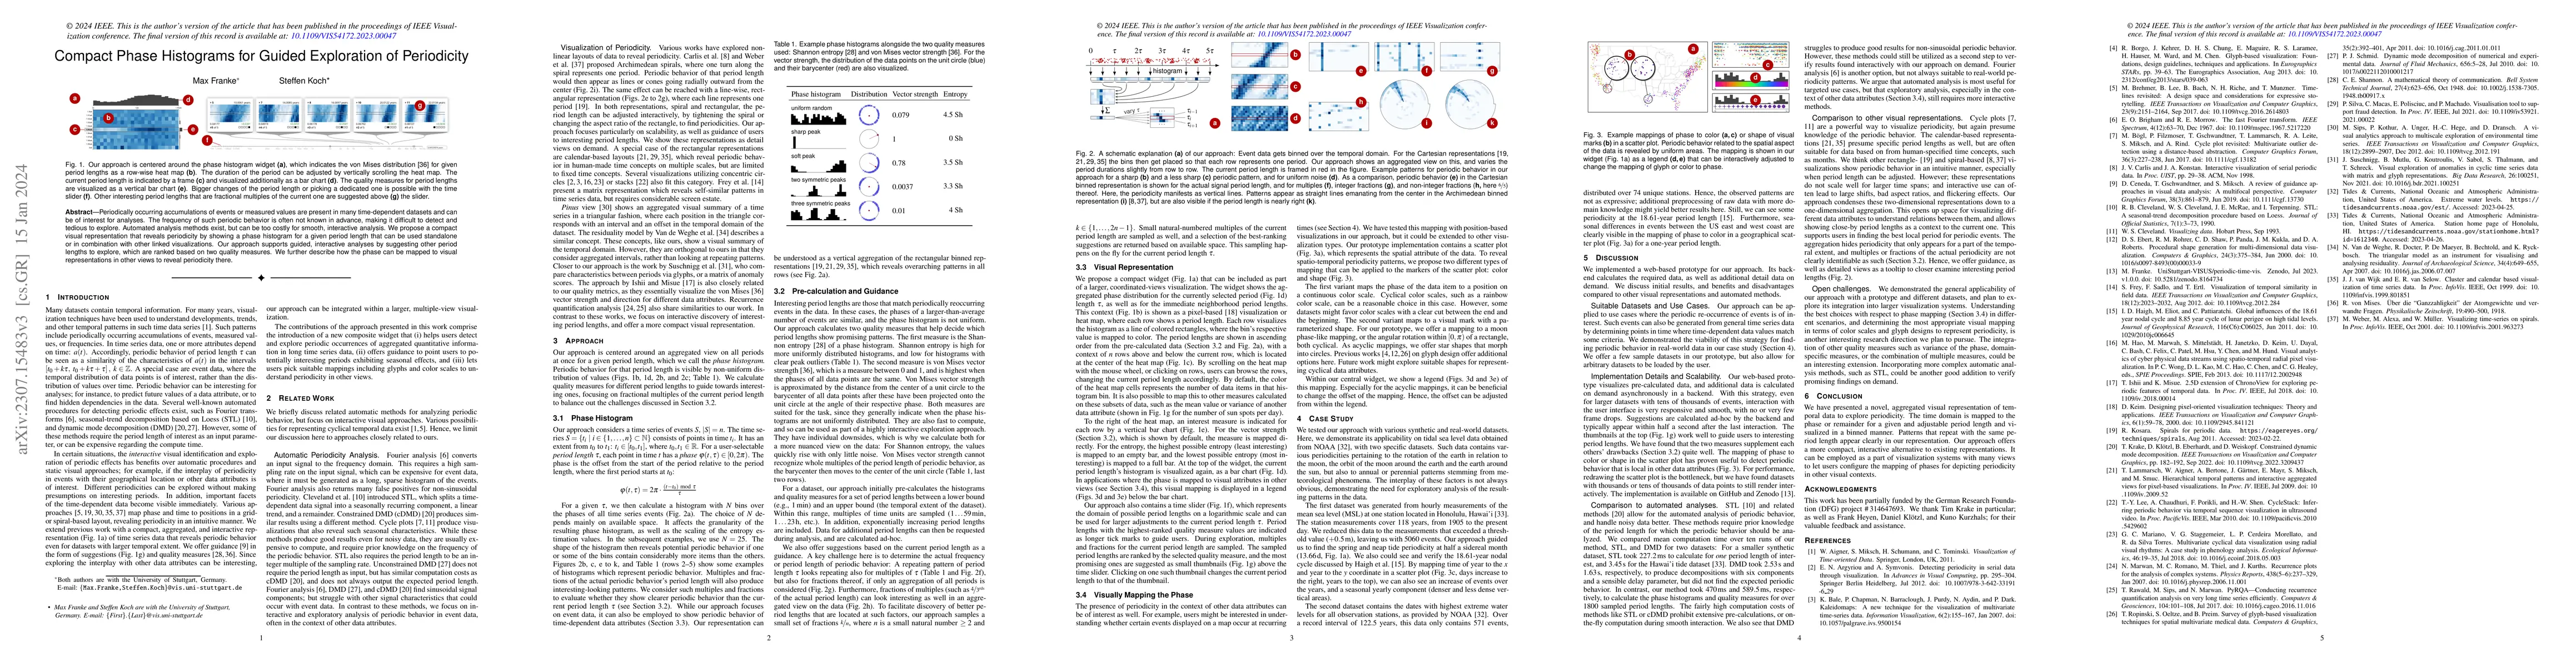
Periodically occurring accumulations of events or measured values are present in many time-dependent datasets and can be of interest for analyses. The frequency of such periodic behavior is often not known in advance, making it difficult to detect and tedious to explore. Automated analysis methods exist, but can be too costly for smooth, interactive analysis. We propose a compact visual representation that reveals periodicity by showing a phase histogram for a given period length that can be used standalone or in combination with other linked visualizations. Our approach supports guided, interactive analyses by suggesting other period lengths to explore, which are ranked based on two quality measures. We further describe how the phase can be mapped to visual representations in other views to reveal periodicity there.
AI Key Findings
Get AI-generated insights about this paper's methodology, results, significance, and more — seven facets brought into focus.
Impact
Paper Details
Authors
PDF Preview
Key Terms
Citation Network
Current paper (gray), citations (green), references (blue)
Display is limited for performance on very large graphs.
Discussion 0