Comparative Analysis of Plastid Genomes Using Pangenome Research ToolKit (PGR-TK)
Publication
Metrics
AI Quick Summary
This study evaluates the Pangenome Research Tool Kit (PGR-TK) for comparative analysis of plastid genomes, demonstrating its effectiveness in recognizing structural features and generating cladograms for genera like Magnolia, Solanum, Fragaria, and Cotoneaster. The tool successfully groups species and reveals insights into genome evolution without gene annotations.
Paper Preview
Abstract
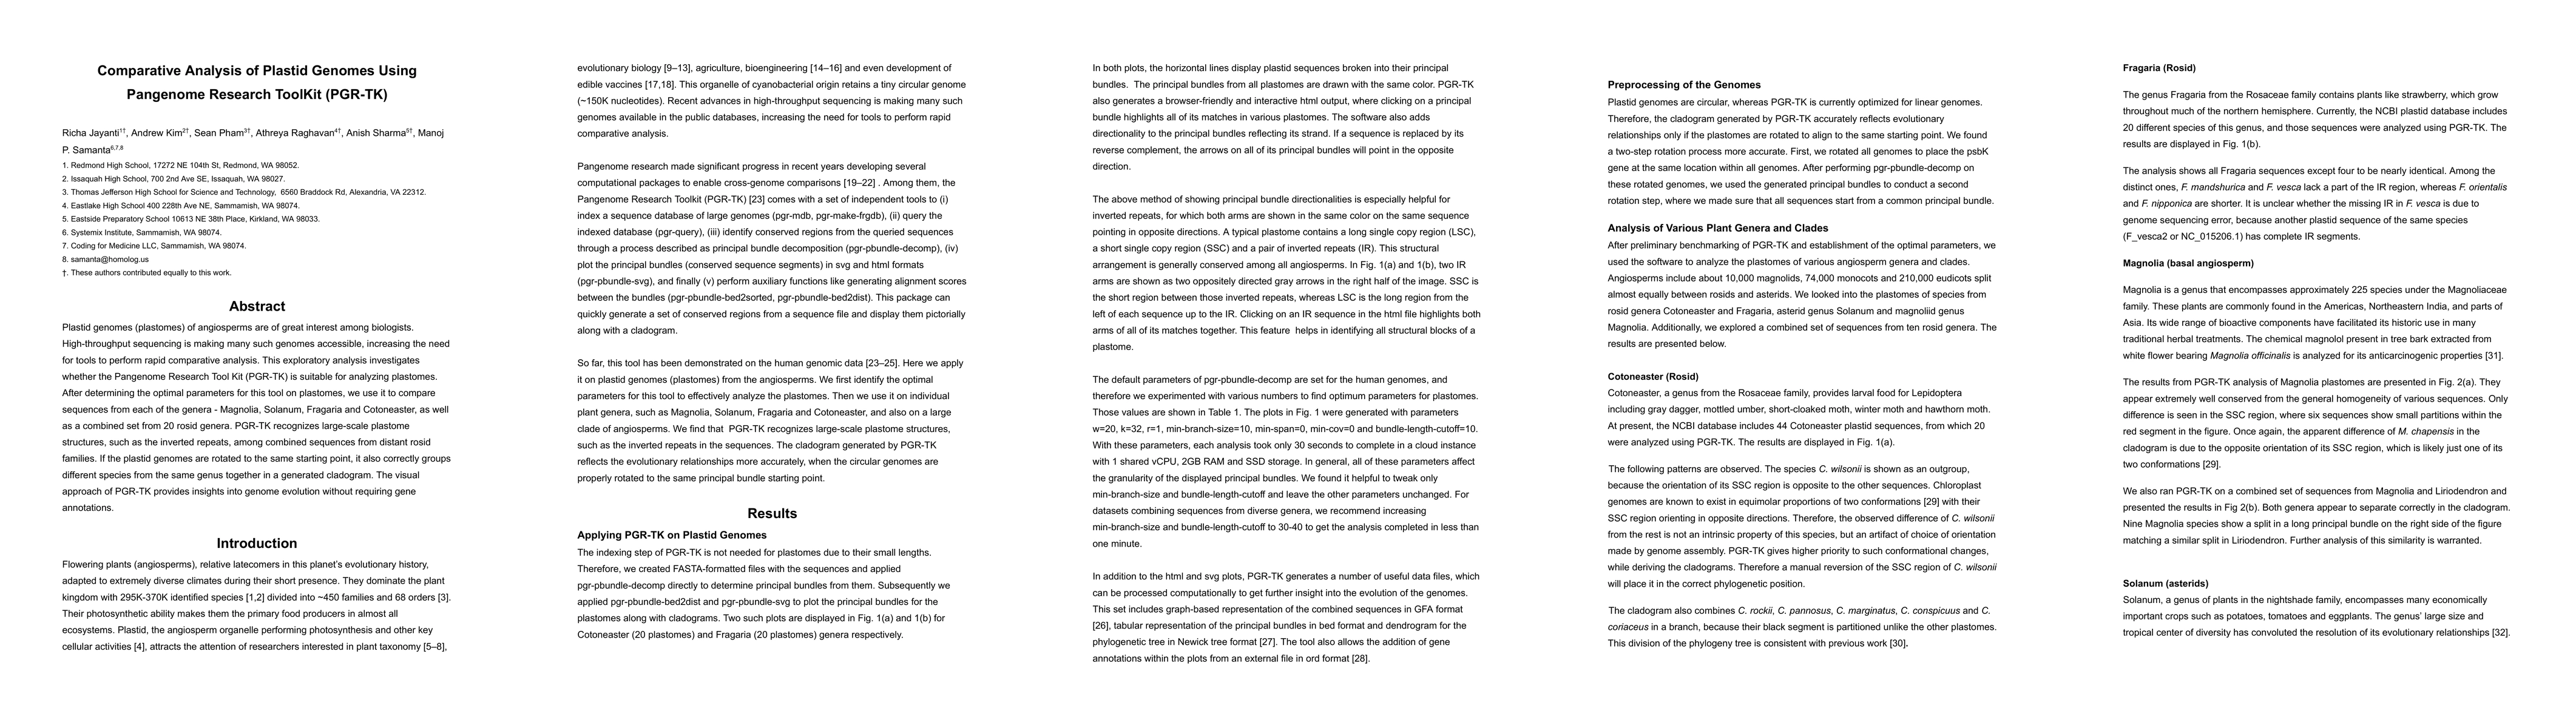
Plastid genomes (plastomes) of angiosperms are of great interest among biologists. High-throughput sequencing is making many such genomes accessible, increasing the need for tools to perform rapid comparative analysis. This exploratory analysis investigates whether the Pangenome Research Tool Kit (PGR-TK) is suitable for analyzing plastomes. After determining the optimal parameters for this tool on plastomes, we use it to compare sequences from each of the genera - Magnolia, Solanum, Fragaria and Cotoneaster, as well as a combined set from 20 rosid genera. PGR-TK recognizes large-scale plastome structures, such as the inverted repeats, among combined sequences from distant rosid families. If the plastid genomes are rotated to the same starting point, it also correctly groups different species from the same genus together in a generated cladogram. The visual approach of PGR-TK provides insights into genome evolution without requiring gene annotations.
AI Key Findings
Get AI-generated insights about this paper's methodology, results, significance, and more — seven facets brought into focus.
Impact
Paper Details
Authors
PDF Preview
Key Terms
Citation Network
Current paper (gray), citations (green), references (blue)
Display is limited for performance on very large graphs.
Discussion 0