Publication
Metrics
AI Quick Summary
This paper compares Pearson and Spearman correlation coefficients across various distributions and sample sizes through simulations and empirical data. It finds that Spearman is more robust to outliers and heavy-tailed distributions, showing lower variability and better accuracy compared to Pearson, which performs better for normally distributed data.
Paper Preview
Abstract
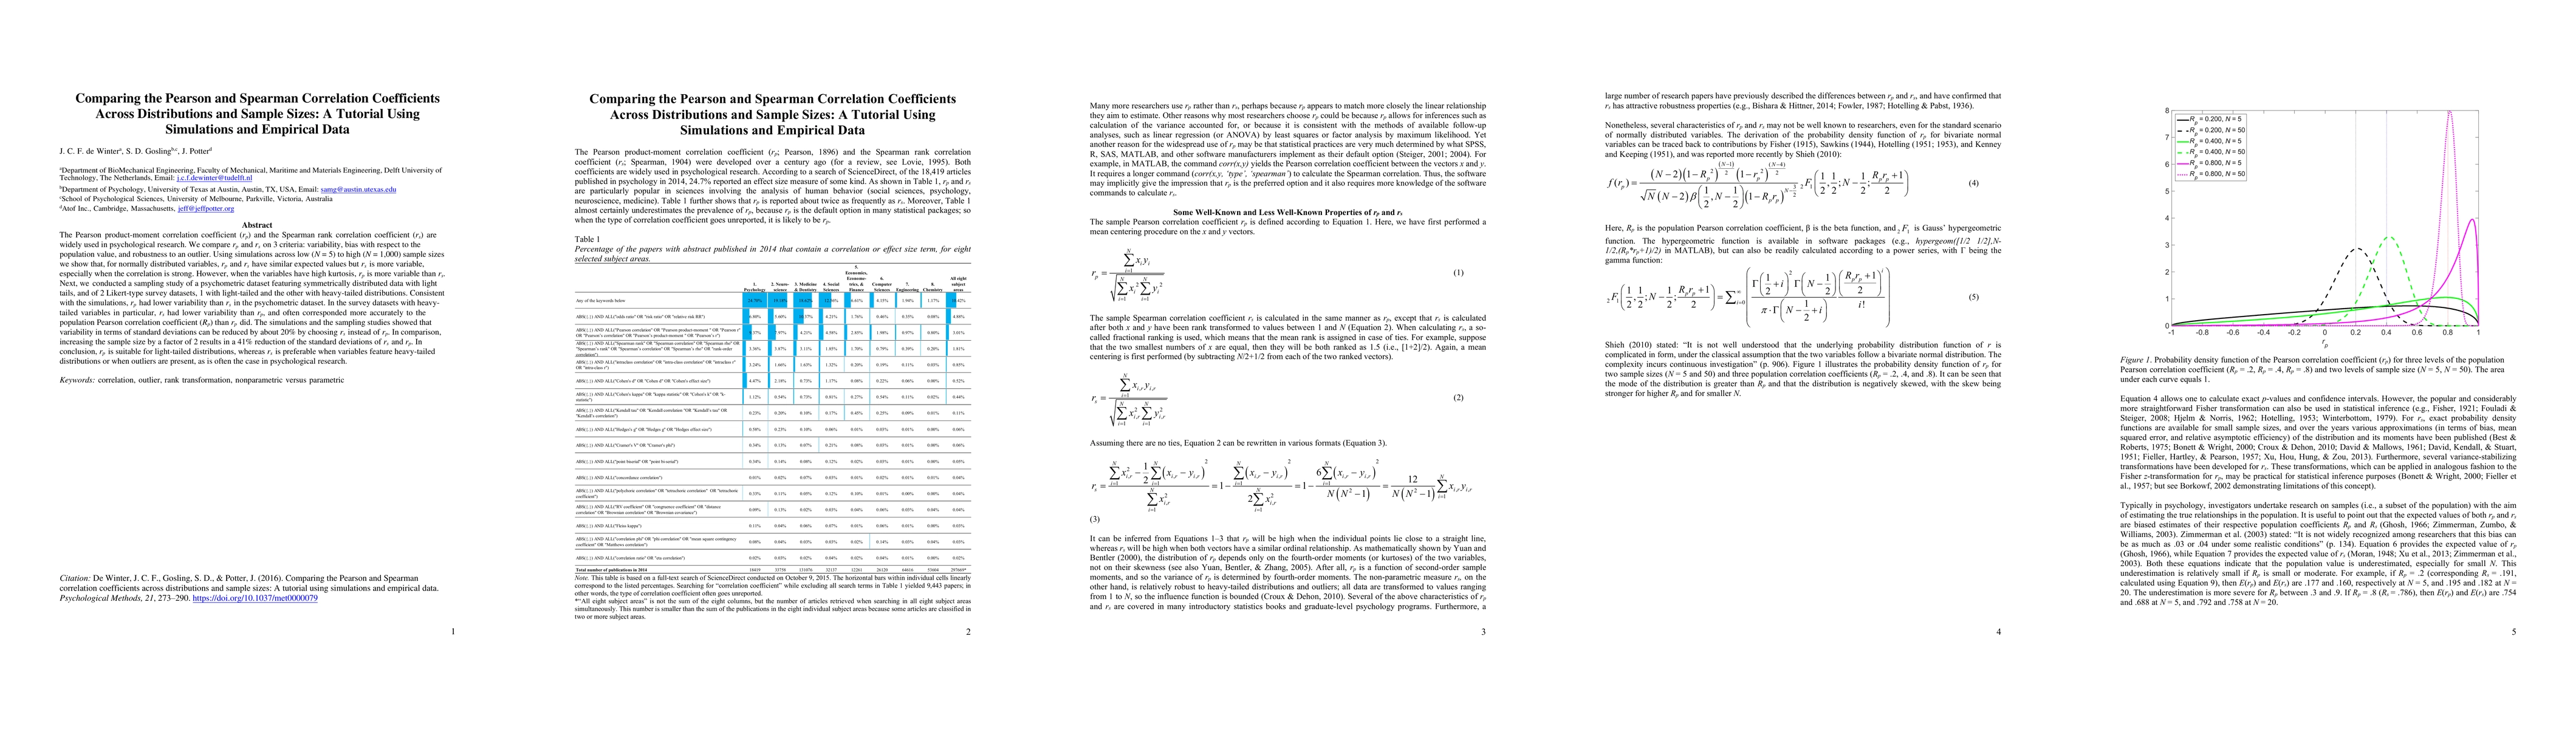
The Pearson product-moment correlation coefficient (rp) and the Spearman rank correlation coefficient (rs) are widely used in psychological research. We compare rp and rs on 3 criteria: variability, bias with respect to the population value, and robustness to an outlier. Using simulations across low (N = 5) to high (N = 1,000) sample sizes we show that, for normally distributed variables, rp and rs have similar expected values but rs is more variable, especially when the correlation is strong. However, when the variables have high kurtosis, rp is more variable than rs. Next, we conducted a sampling study of a psychometric dataset featuring symmetrically distributed data with light tails, and of 2 Likert-type survey datasets, 1 with light-tailed and the other with heavy-tailed distributions. Consistent with the simulations, rp had lower variability than rs in the psychometric dataset. In the survey datasets with heavy-tailed variables in particular, rs had lower variability than rp, and often corresponded more accurately to the population Pearson correlation coefficient (Rp) than rp did. The simulations and the sampling studies showed that variability in terms of standard deviations can be reduced by about 20% by choosing rs instead of rp. In comparison, increasing the sample size by a factor of 2 results in a 41% reduction of the standard deviations of rs and rp. In conclusion, rp is suitable for light-tailed distributions, whereas rs is preferable when variables feature heavy-tailed distributions or when outliers are present, as is often the case in psychological research.
AI Key Findings
Get AI-generated insights about this paper's methodology, results, significance, and more — seven facets brought into focus.
Impact
Authors
PDF Preview
Citation Network
Current paper (gray), citations (green), references (blue)
Display is limited for performance on very large graphs.
Discussion 0