Comparing Two Samples Through Stochastic Dominance: A Graphical Approach
Publication
Metrics
AI Quick Summary
This paper proposes a graphical approach to visually compare two samples based on stochastic dominance, introducing a dominance measure and a decomposition method to analyze cumulative distribution functions. The methodology is demonstrated through a re-evaluation of an existing study, revealing additional insights not captured by traditional methods.
Paper Preview
Abstract
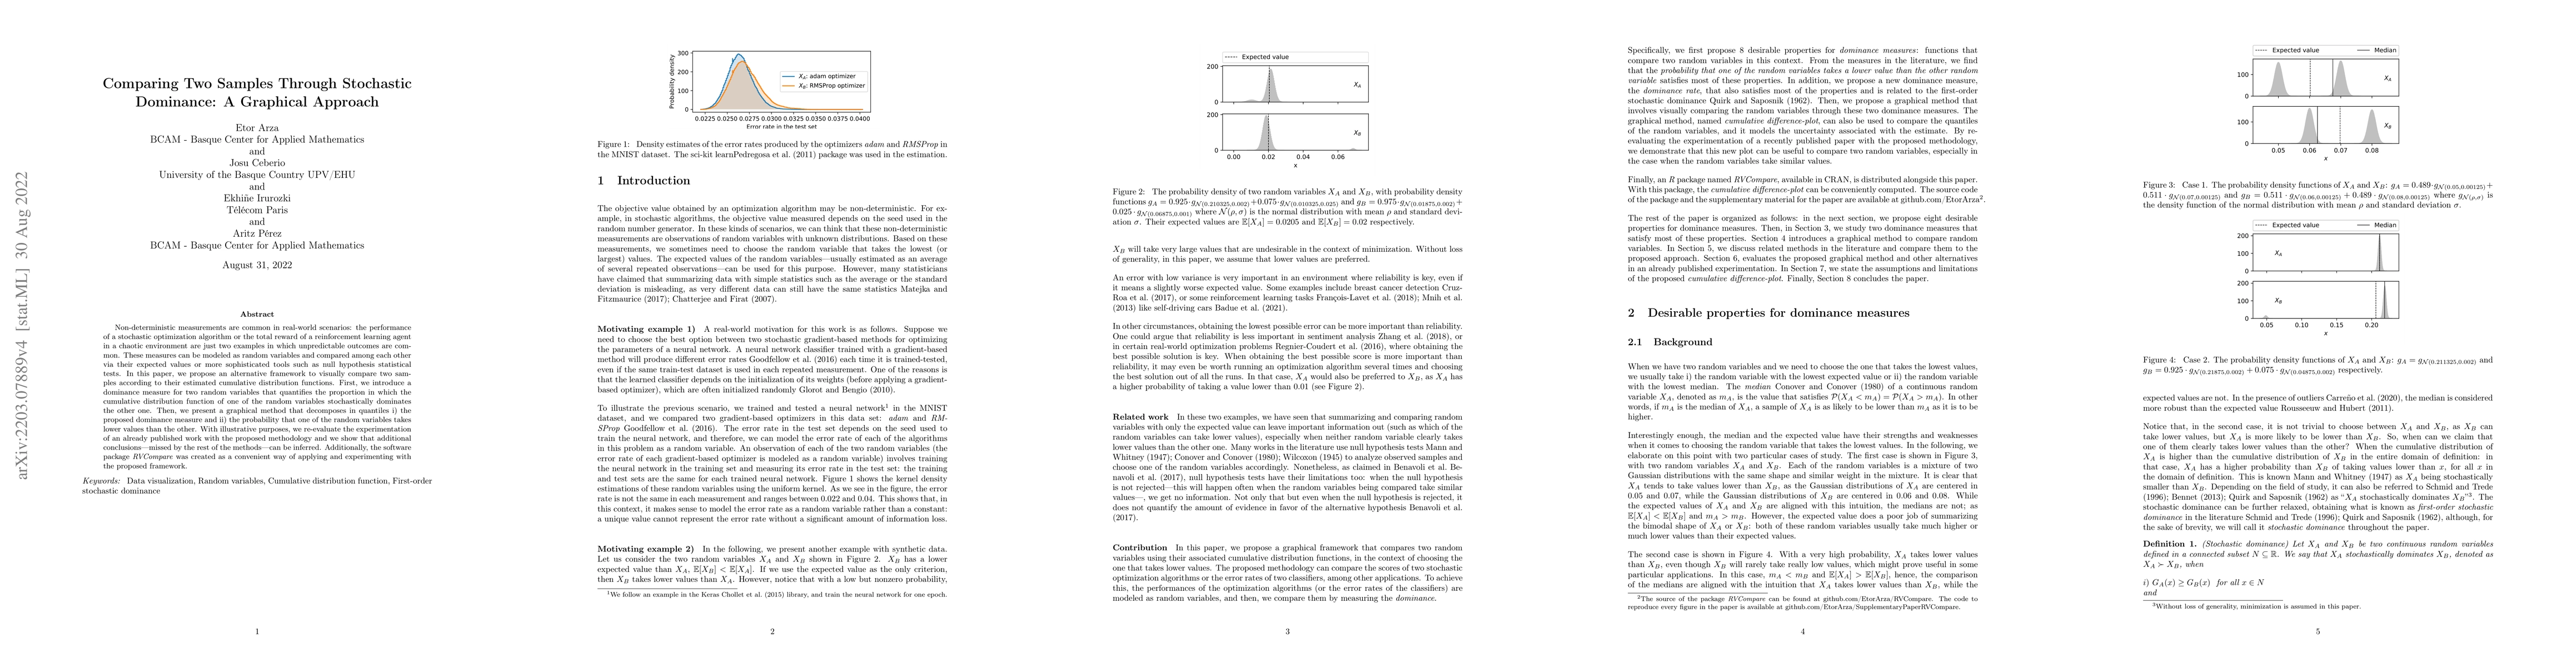
Non-deterministic measurements are common in real-world scenarios: the performance of a stochastic optimization algorithm or the total reward of a reinforcement learning agent in a chaotic environment are just two examples in which unpredictable outcomes are common. These measures can be modeled as random variables and compared among each other via their expected values or more sophisticated tools such as null hypothesis statistical tests. In this paper, we propose an alternative framework to visually compare two samples according to their estimated cumulative distribution functions. First, we introduce a dominance measure for two random variables that quantifies the proportion in which the cumulative distribution function of one of the random variables stochastically dominates the other one. Then, we present a graphical method that decomposes in quantiles i) the proposed dominance measure and ii) the probability that one of the random variables takes lower values than the other. With illustrative purposes, we re-evaluate the experimentation of an already published work with the proposed methodology and we show that additional conclusions (missed by the rest of the methods) can be inferred. Additionally, the software package RVCompare was created as a convenient way of applying and experimenting with the proposed framework.
AI Key Findings
Get AI-generated insights about this paper's methodology, results, significance, and more — seven facets brought into focus.
Impact
Paper Details
Authors
PDF Preview
Key Terms
Citation Network
Current paper (gray), citations (green), references (blue)
Display is limited for performance on very large graphs.
Discussion 0