Summary
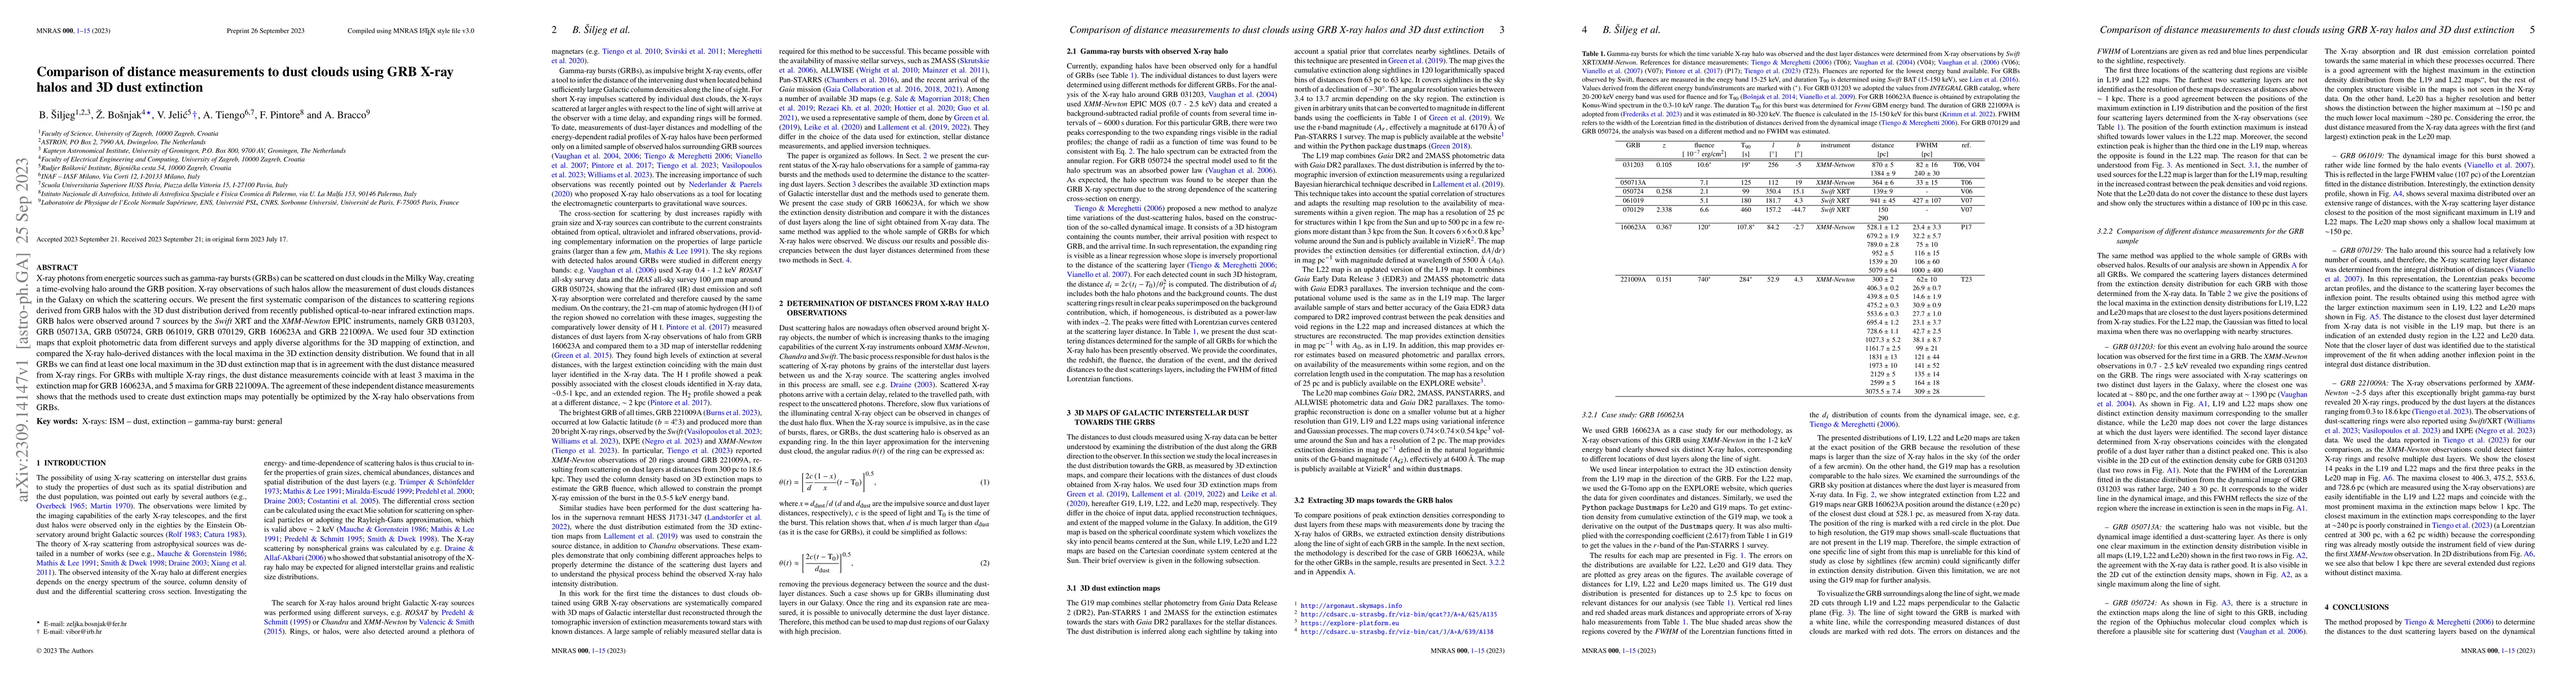
X-ray photons from energetic sources such as gamma-ray bursts (GRBs) can be scattered on dust clouds in the Milky Way, creating a time-evolving halo around the GRB position. X-ray observations of such halos allow the measurement of dust clouds distances in the Galaxy on which the scattering occurs. We present the first systematic comparison of the distances to scattering regions derived from GRB halos with the 3D dust distribution derived from recently published optical-to-near infrared extinction maps. GRB halos were observed around 7 sources by the Swift XRT and the XMM-Newton EPIC instruments, namely GRB 031203, GRB 050713A, GRB 050724, GRB 061019, GRB 070129, GRB 160623A and GRB 221009A. We used four 3D extinction maps that exploit photometric data from different surveys and apply diverse algorithms for the 3D mapping of extinction, and compared the X-ray halo-derived distances with the local maxima in the 3D extinction density distribution. We found that in all GRBs we can find at least one local maximum in the 3D dust extinction map that is in agreement with the dust distance measured from X-ray rings. For GRBs with multiple X-ray rings, the dust distance measurements coincide with at least 3 maxima in the extinction map for GRB 160623A, and 5 maxima for GRB 221009A. The agreement of these independent distance measurements shows that the methods used to create dust extinction maps may potentially be optimized by the X-ray halo observations from GRBs.
AI Key Findings
Get AI-generated insights about this paper's methodology, results, and significance.
Paper Details
PDF Preview
Key Terms
Citation Network
Current paper (gray), citations (green), references (blue)
Display is limited for performance on very large graphs.
No citations found for this paper.
Comments (0)