Summary
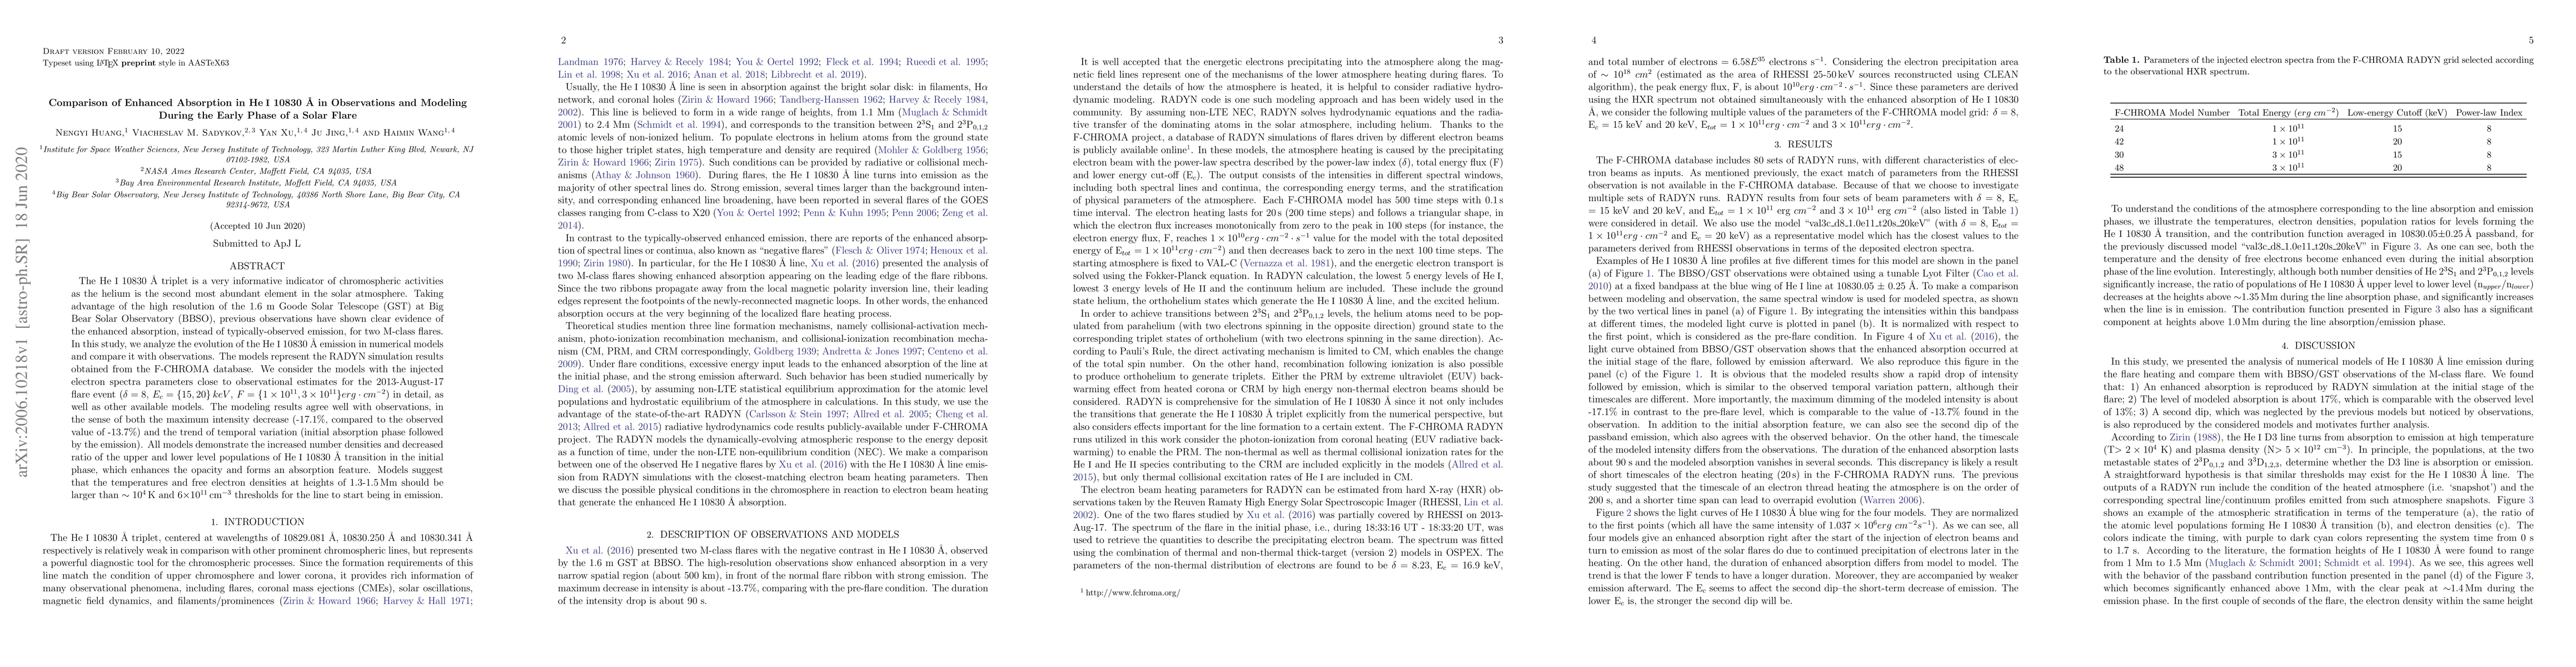
The He I 10830 \AA\ triplet is a very informative indicator of chromospheric activities as the helium is the second most abundant element in the solar atmosphere. Taking advantage of the high resolution of the 1.6 m Goode Solar Telescope (GST) at Big Bear Solar Observatory (BBSO), previous observations have shown clear evidence of the enhanced absorption, instead of typically-observed emission, for two M-class flares. In this study, we analyze the evolution of the He I 10830 10830 \AA\ emission in numerical models and compare it with observations. The models represent the RADYN simulation results obtained from the F-CHROMA database. We consider the models with the injected electron spectra parameters close to observational estimates for the 2013-August-17 flare event ($\delta=8$, $E_c = \{15,20\}$ keV, $F=\{1\times 10^{11}, 3\times{}10^{11}\}$ erg cm$^{-2}$) in detail, as well as other available models. The modeling results agree well with observations, in the sense of both the maximum intensity decrease (-17.1%, compared to the observed value of -13.7%) and the trend of temporal variation (initial absorption phase followed by the emission). All models demonstrate the increased number densities and decreased ratio of the upper and lower level populations of He I 10830 10830 \AA\ transition in the initial phase, which enhances the opacity and forms an absorption feature. Models suggest that the temperatures and free electron densities at heights of 1.3-1.5 Mm should be larger than $\sim 10^4$ K and $6\times 10^{11}$ cm$^{-3}$ thresholds for the line to start being in emission.
AI Key Findings
Get AI-generated insights about this paper's methodology, results, and significance.
Paper Details
PDF Preview
Key Terms
Citation Network
Current paper (gray), citations (green), references (blue)
Display is limited for performance on very large graphs.
Similar Papers
Found 4 papersMulti-Passband Observations of A Solar Flare over the He I 10830 \AA\ line
Xu Yang, Yan Xu, Graham S. Kerr et al.
| Title | Authors | Year | Actions |
|---|
Comments (0)