Publication
Metrics
AI Quick Summary
The paper compares solar fine structure observed in the Ly-{\alpha} and Mg II h lines using coordinated observations from CLASP and IRIS, finding strong correlation in peak width and intensity between the lines. A 3D radiation-MHD simulation, however, shows a lack of correlation, suggesting differences in line formation heights related to magnetic geometry.
Paper Preview
Abstract
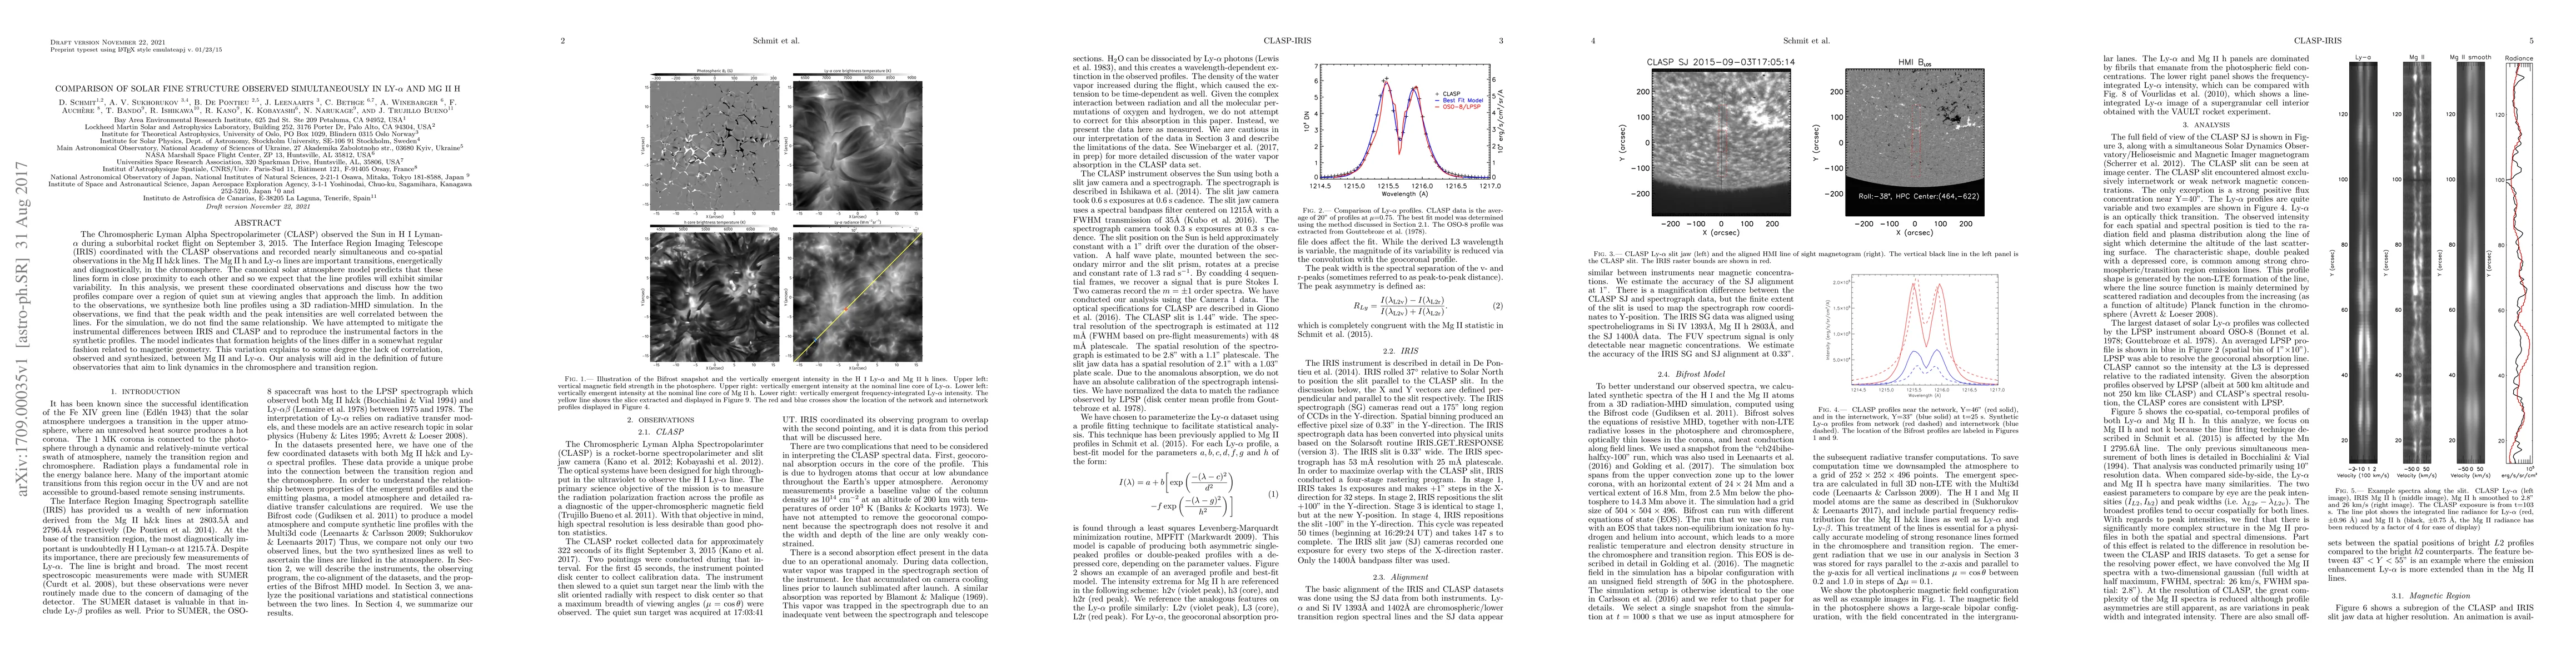
The Chromospheric Lyman Alpha Spectropolarimeter (CLASP) observed the Sun in H I Lyman-{\alpha} during a suborbital rocket flight on September 3, 2015. The Interface Region Imaging Telescope (IRIS) coordinated with the CLASP observations and recorded nearly simultaneous and co-spatial observations in the Mg II h&k lines. The Mg II h and Ly-{\alpha} lines are important transitions, energetically and diagnostically, in the chromosphere. The canonical solar atmosphere model predicts that these lines form in close proximity to each other and so we expect that the line profiles will exhibit similar variability. In this analysis, we present these coordinated observations and discuss how the two profiles compare over a region of quiet sun at viewing angles that approach the limb. In addition to the observations, we synthesize both line profiles using a 3D radiation-MHD simulation. In the observations, we find that the peak width and the peak intensities are well correlated between the lines. For the simulation, we do not find the same relationship. We have attempted to mitigate the instrumental differences between IRIS and CLASP and to reproduce the instrumental factors in the synthetic profiles. The model indicates that formation heights of the lines differ in a somewhat regular fashion related to magnetic geometry. This variation explains to some degree the lack of correlation, observed and synthesized, between Mg II and Ly-{\alpha}. Our analysis will aid in the definition of future observatories that aim to link dynamics in the chromosphere and transition region.
AI Key Findings
Get AI-generated insights about this paper's methodology, results, significance, and more — seven facets brought into focus.
Impact
Paper Details
PDF Preview
Key Terms
Citation Network
Current paper (gray), citations (green), references (blue)
Display is limited for performance on very large graphs.
Discussion 0