Composing DTI Visualizations with End-user Programming
Publication
Metrics
AI Quick Summary
The paper introduces Zifazah, a scientific visualization language designed for neurologists and physicians to freely compose 3D visualizations of diffusion tensor MRI data without programming expertise. Key features include visual symbolic mapping (color, size, shape), a spatial language for 3D object manipulation, and flexible data encoding based on Bertin's semiology. The language is demonstrated with sample scripts and new DTI visualization results.
Paper Preview
Abstract
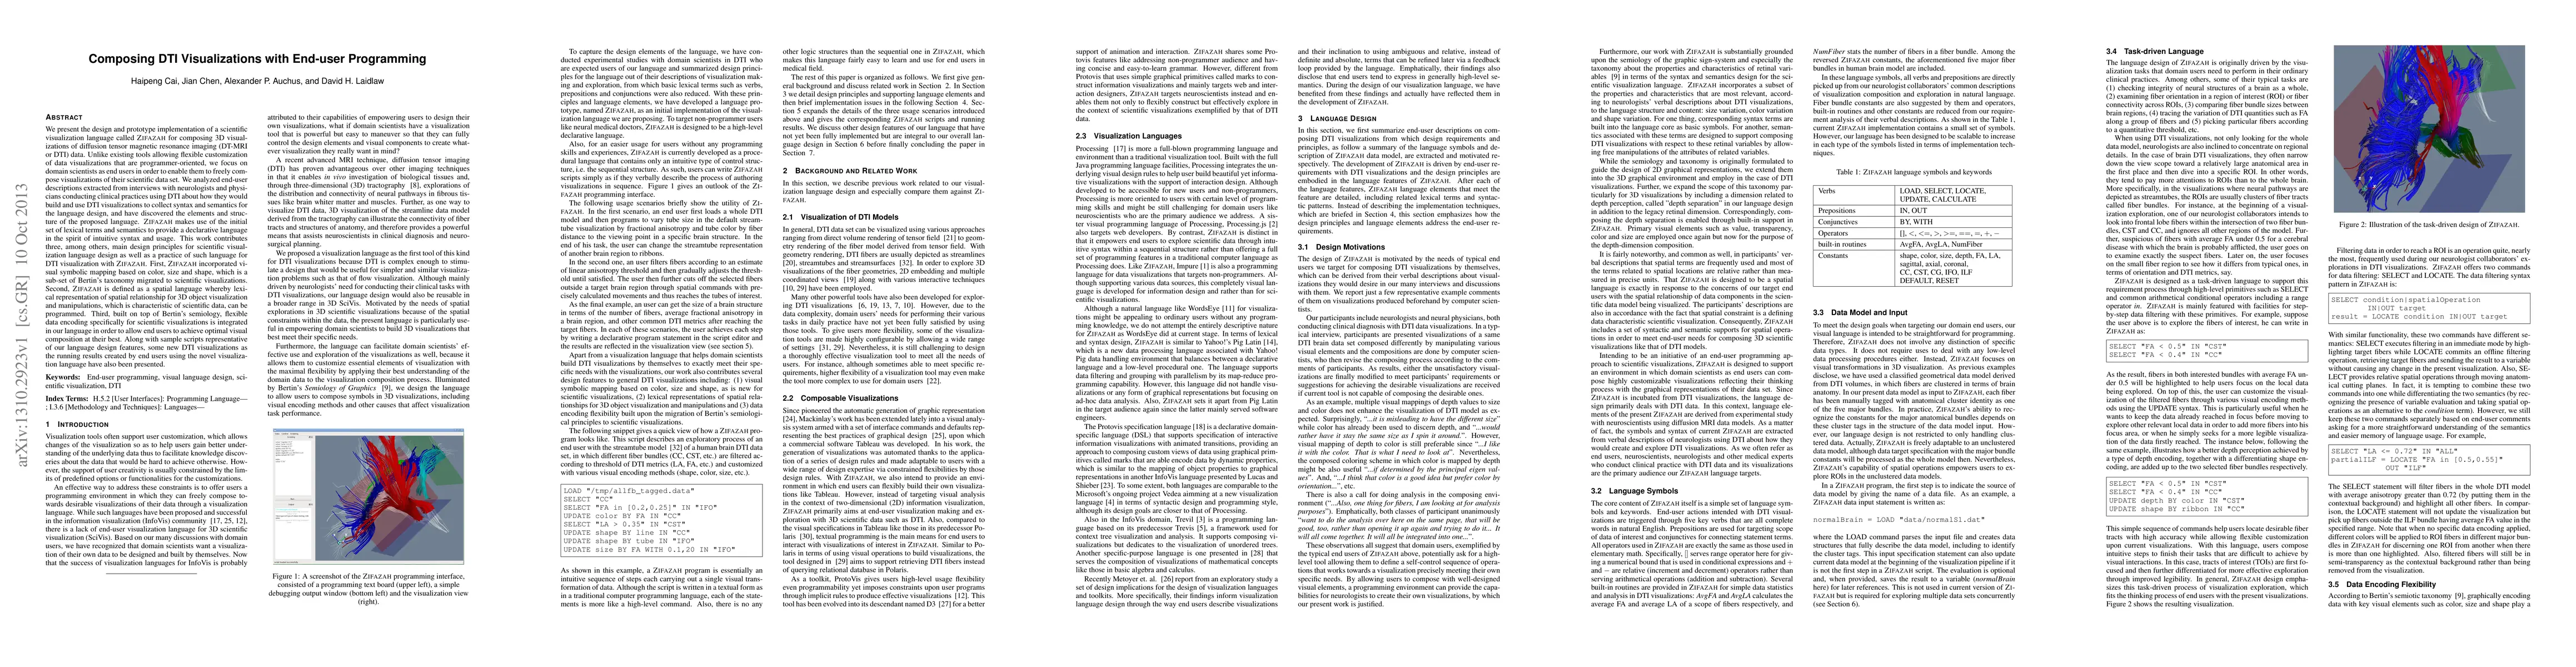
We present the design and prototype implementation of a scientific visualization language called Zifazah for composing 3D visualizations of diffusion tensor magnetic resonance imaging (DT-MRI or DTI) data. Unlike existing tools allowing flexible customization of data visualizations that are programmer-oriented, we focus on domain scientists as end users in order to enable them to freely compose visualizations of their scientific data set. We analyzed end-user descriptions extracted from interviews with neurologists and physicians conducting clinical practices using DTI about how they would build and use DTI visualizations to collect syntax and semantics for the language design, and have discovered the elements and structure of the proposed language. Zifazah makes use of the initial set of lexical terms and semantics to provide a declarative language in the spirit of intuitive syntax and usage. This work contributes three, among others, main design principles for scientific visualization language design as well as a practice of such language for DTI visualization with Zifazah. First, Zifazah incorporated visual symbolic mapping based on color, size and shape, which is a sub-set of Bertin's taxonomy migrated to scientific visualizations. Second, Zifazah is defined as a spatial language whereby lexical representation of spatial relationship for 3D object visualization and manipulations, which is characteristic of scientific data, can be programmed. Third, built on top of Bertin's semiology, flexible data encoding specifically for scientific visualizations is integrated in our language in order to allow end users to achieve optimal visual composition at their best. Along with sample scripts representative of our language design features, some new DTI visualizations as the running results created by end users using the novel visualization language have also been presented.
AI Key Findings
Get AI-generated insights about this paper's methodology, results, significance, and more — seven facets brought into focus.
Impact
Paper Details
PDF Preview
Key Terms
Citation Network
Current paper (gray), citations (green), references (blue)
Display is limited for performance on very large graphs.
Discussion 0