Compound heat wave and PM2.5 pollution episodes in U.S. cities
Publication
Metrics
AI Quick Summary
This study investigates compound heat wave and PM2.5 pollution episodes in U.S. cities, comparing urban and rural areas. It finds that the West and Southwest regions experience the most significant differences in event frequency, intensity, and duration, with heat waves being the most impactful in urban areas.
Paper Preview
Abstract
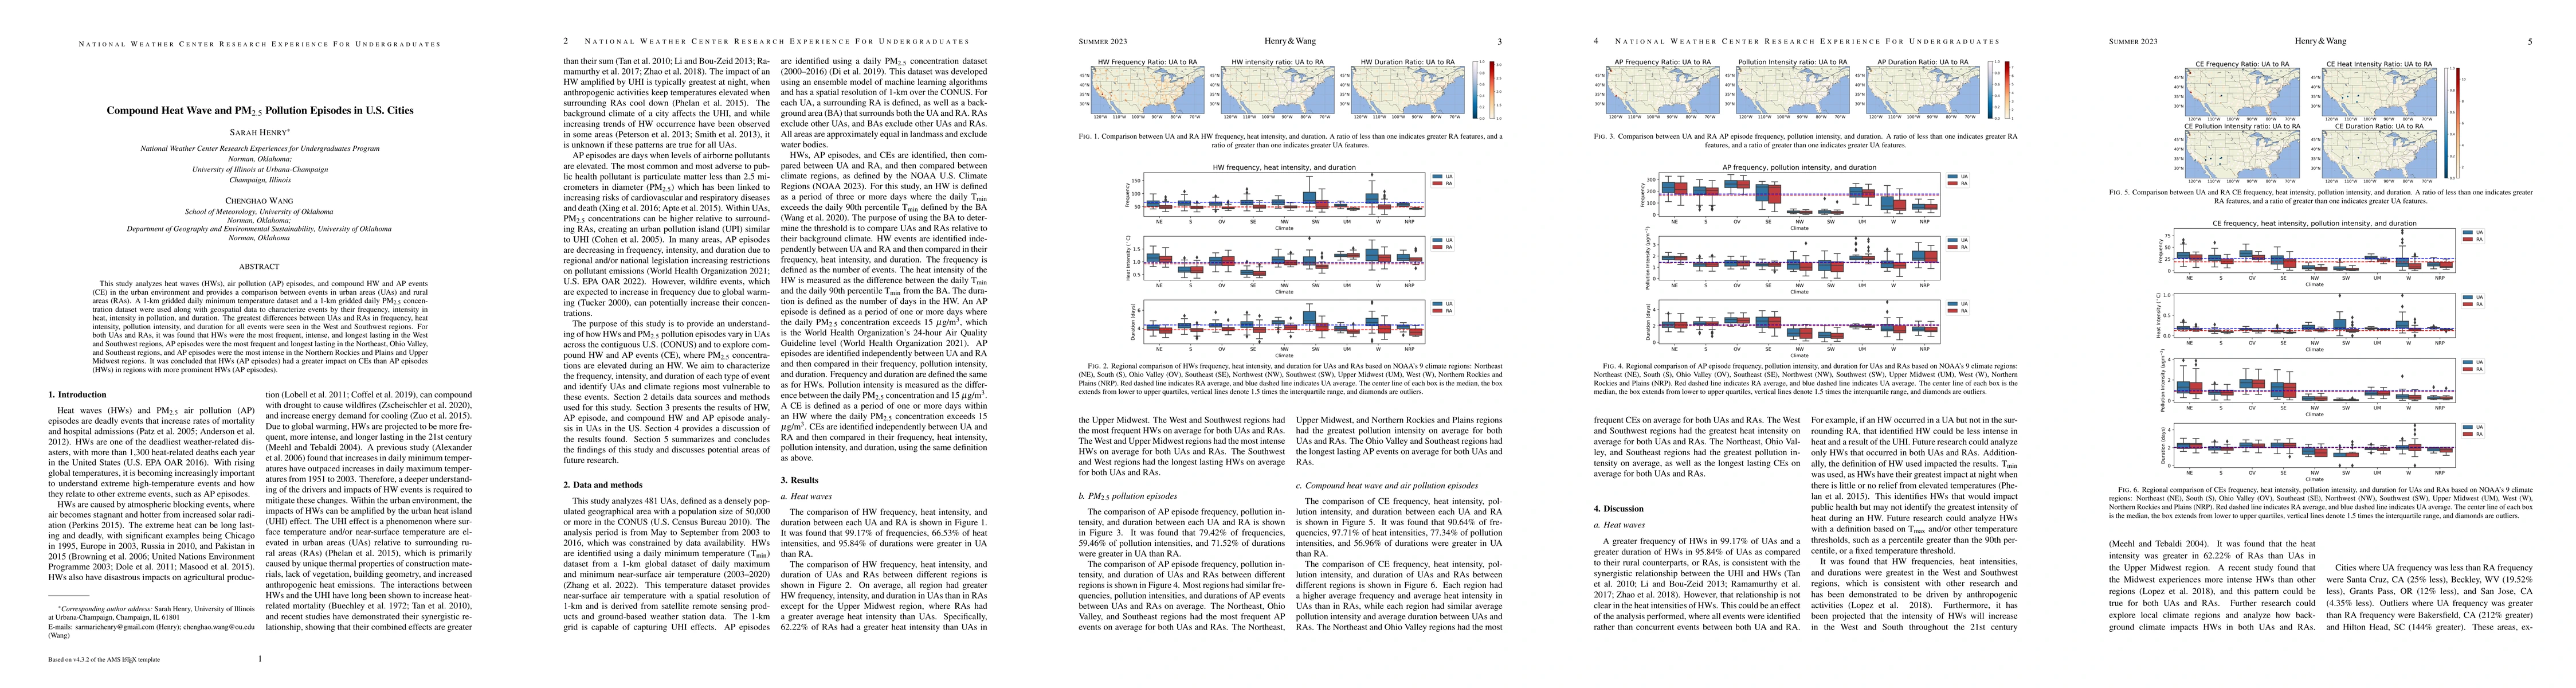
This study analyzes heat waves (HWs), air pollution (AP) episodes, and compound HW and AP events (CE) in the urban environment and provides a comparison between events in urban areas (UAs) and rural areas (RAs). A 1-km gridded daily minimum temperature dataset and a 1-km gridded daily PM2.5 concentration dataset were used along with geospatial data to characterize events by their frequency, intensity in heat, intensity in pollution, and duration. The greatest differences between UAs and RAs in frequency, heat intensity, pollution intensity, and duration for all events were seen in the West and Southwest regions. For both UAs and RAs, it was found that HWs were the most frequent, intense, and longest lasting in the West and Southwest regions, AP episodes were the most frequent and longest lasting in the Northeast, Ohio Valley, and Southeast regions, and AP episodes were the most intense in the Northern Rockies and Plains and Upper Midwest regions. It was concluded that HWs (AP episodes) had a greater impact on CEs than AP episodes (HWs) in regions with more prominent HWs (AP episodes).
AI Key Findings
Get AI-generated insights about this paper's methodology, results, significance, and more — seven facets brought into focus.
Impact
Paper Details
Authors
PDF Preview
Key Terms
Citation Network
Current paper (gray), citations (green), references (blue)
Display is limited for performance on very large graphs.
Discussion 0