Publication

Published: Aug 09, 2025
Categories: cs.CG, math.MG

Metrics

Source: ArXiv

Quick Actions

View PDF

Quick Answers

What methodology did the authors use?

The research investigates the compressibility barriers of neighborhood-preserving data visualizations by reframing the problem in terms of embedding n-vertex graphs into metric spaces of low doubling dimension while maintaining neighbor and non-neighbor separation. More in Methodology →

What are the key results?

An overwhelming fraction of graphs require d = Ω(log n) for general metrics and sparse regular graphs. — Embedding into normed spaces demands d = Θ(n) for all but a vanishing fraction of graphs. More in Key Results →

Why is this work significant?

The findings challenge the aspiration that constant-dimensional visualizations can faithfully preserve neighborhood structure, highlighting the difficulty in visualizing high-dimensional datasets in lower dimensions. More in Significance →

What are the main limitations?

The study focuses on specific types of graphs and does not explore all possible data structures. — The results are based on theoretical analysis and may not directly translate to all practical data visualization scenarios. More in Limitations →

Paper Preview

Abstract

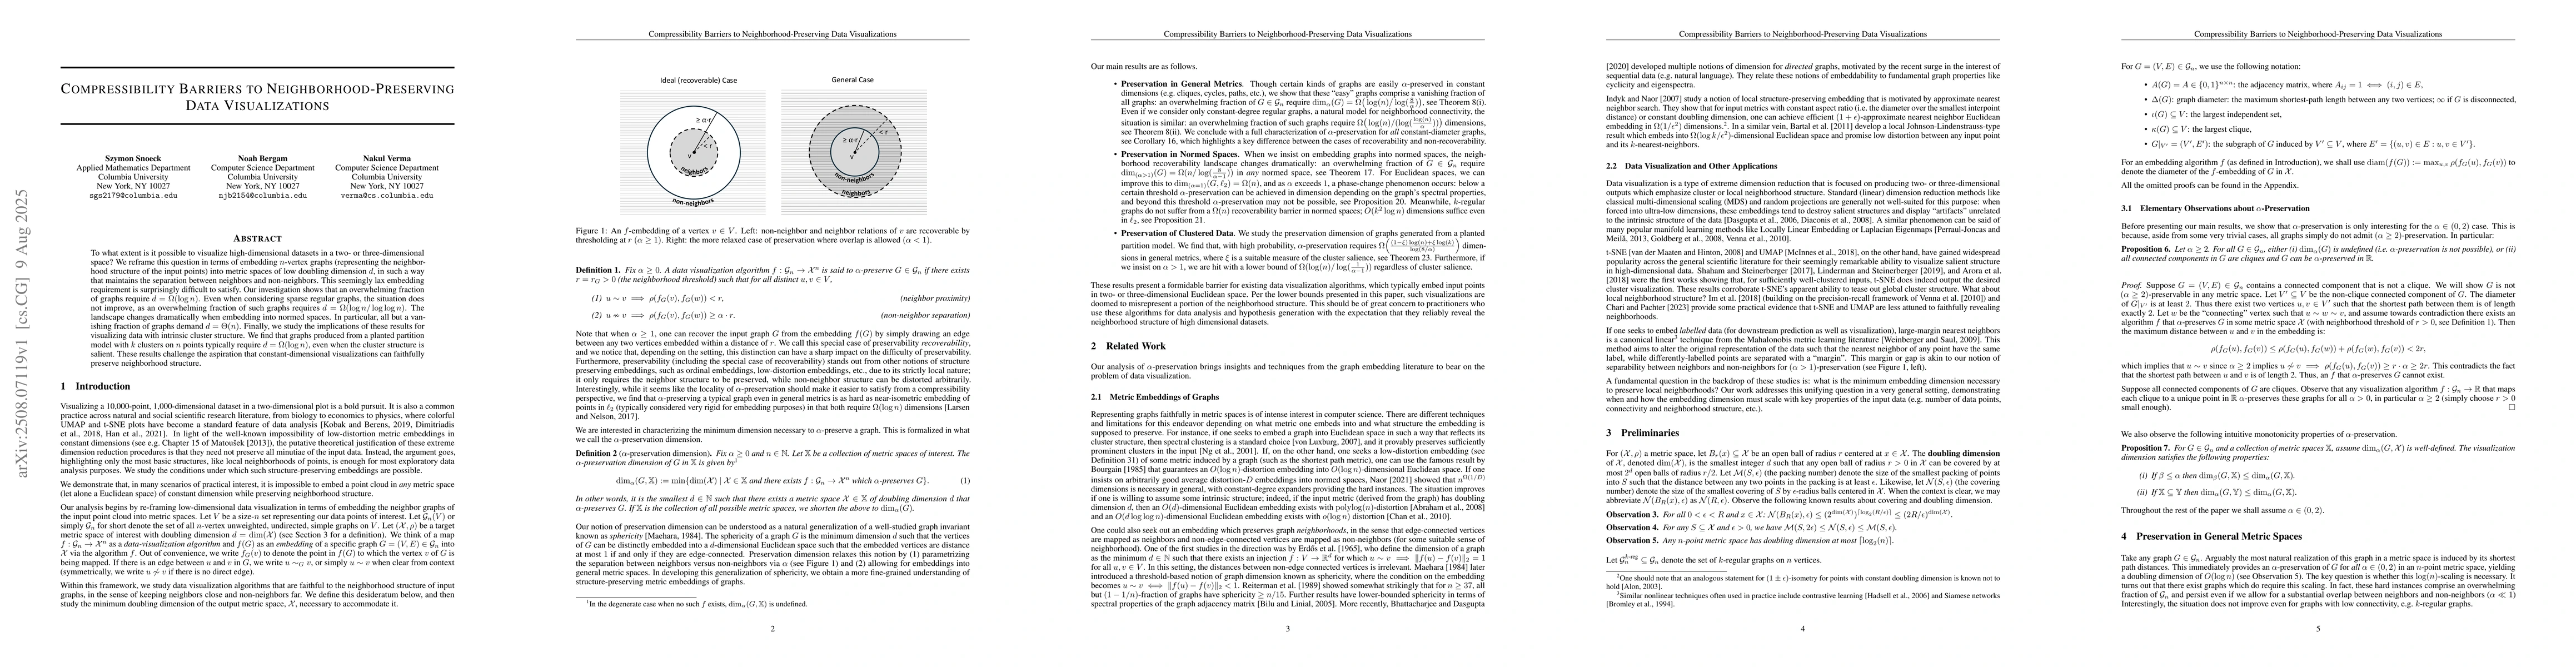
To what extent is it possible to visualize high-dimensional datasets in a two- or three-dimensional space? We reframe this question in terms of embedding $n$-vertex graphs (representing the neighborhood structure of the input points) into metric spaces of low doubling dimension $d$, in such a way that maintains the separation between neighbors and non-neighbors. This seemingly lax embedding requirement is surprisingly difficult to satisfy. Our investigation shows that an overwhelming fraction of graphs require $d = \Omega(\log n)$. Even when considering sparse regular graphs, the situation does not improve, as an overwhelming fraction of such graphs requires $d= \Omega(\log n / \log\log n)$. The landscape changes dramatically when embedding into normed spaces. In particular, all but a vanishing fraction of graphs demand $d=\Theta(n)$. Finally, we study the implications of these results for visualizing data with intrinsic cluster structure. We find that graphs produced from a planted partition model with $k$ clusters on $n$ points typically require $d=\Omega(\log n)$, even when the cluster structure is salient. These results challenge the aspiration that constant-dimensional visualizations can faithfully preserve neighborhood structure.

AI Key Findings

Generated Aug 14, 2025

Methodology — What approach did the authors take?

The research investigates the compressibility barriers of neighborhood-preserving data visualizations by reframing the problem in terms of embedding n-vertex graphs into metric spaces of low doubling dimension while maintaining neighbor and non-neighbor separation.

Key Results — What are the main findings?

  • An overwhelming fraction of graphs require d = Ω(log n) for general metrics and sparse regular graphs.
  • Embedding into normed spaces demands d = Θ(n) for all but a vanishing fraction of graphs.
  • Graphs produced from a planted partition model with k clusters on n points typically require d = Ω(log n) even with salient cluster structure.

Significance — Why does this research matter?

The findings challenge the aspiration that constant-dimensional visualizations can faithfully preserve neighborhood structure, highlighting the difficulty in visualizing high-dimensional datasets in lower dimensions.

Technical Contribution — What is the technical contribution?

The paper introduces a framework for analyzing the compressibility of neighborhood-preserving data visualizations, providing both upper and lower bounds on the embedding dimension required to maintain neighborhood relationships.

Novelty — What is new about this work?

The research offers a novel perspective on data visualization by framing the problem in terms of graph embeddings and doubling dimensions, revealing that maintaining neighborhood structure in lower dimensions is surprisingly challenging.

Limitations — What are the limitations of this study?

  • The study focuses on specific types of graphs and does not explore all possible data structures.
  • The results are based on theoretical analysis and may not directly translate to all practical data visualization scenarios.

Future Work — What did the authors propose for future work?

  • Investigate the implications of these results for specific data visualization algorithms like t-SNE and UMAP.
  • Explore how noise and between-cluster relationships affect neighborhood preservation in data visualizations.

Paper Details

Paper ID: 2508.07119
Categories:
cs.CG math.MG

How to Cite This Paper

BibTeX
@article{verma2025compressibility,
  title         = {Compressibility Barriers to Neighborhood-Preserving Data Visualizations},
  author        = {Verma, Nakul and Bergam, Noah and Snoeck, Szymon},
  year          = {2025},
  eprint        = {2508.07119},
  archivePrefix = {arXiv},
  primaryClass  = {cs.CG},
}
APA 7
Verma, N., Bergam, N., & Snoeck, S. (2025). Compressibility Barriers to Neighborhood-Preserving Data Visualizations. arXiv. https://arxiv.org/abs/2508.07119
MLA 9
Verma, Nakul, et al. "Compressibility Barriers to Neighborhood-Preserving Data Visualizations." arXiv, 2025, arxiv.org/abs/2508.07119.

Similar Papers

Found 4 papers

Comments (0)

This website uses cookies to ensure you get the best experience. Learn more