ConceptExplorer: Visual Analysis of Concept Driftsin Multi-source Time-series Data
Publication
Metrics
AI Quick Summary
A new visual analysis approach, ConceptExplorer, detects concept drifts in multi-sourced time-series data to better understand dynamic environments.
Paper Preview
Abstract
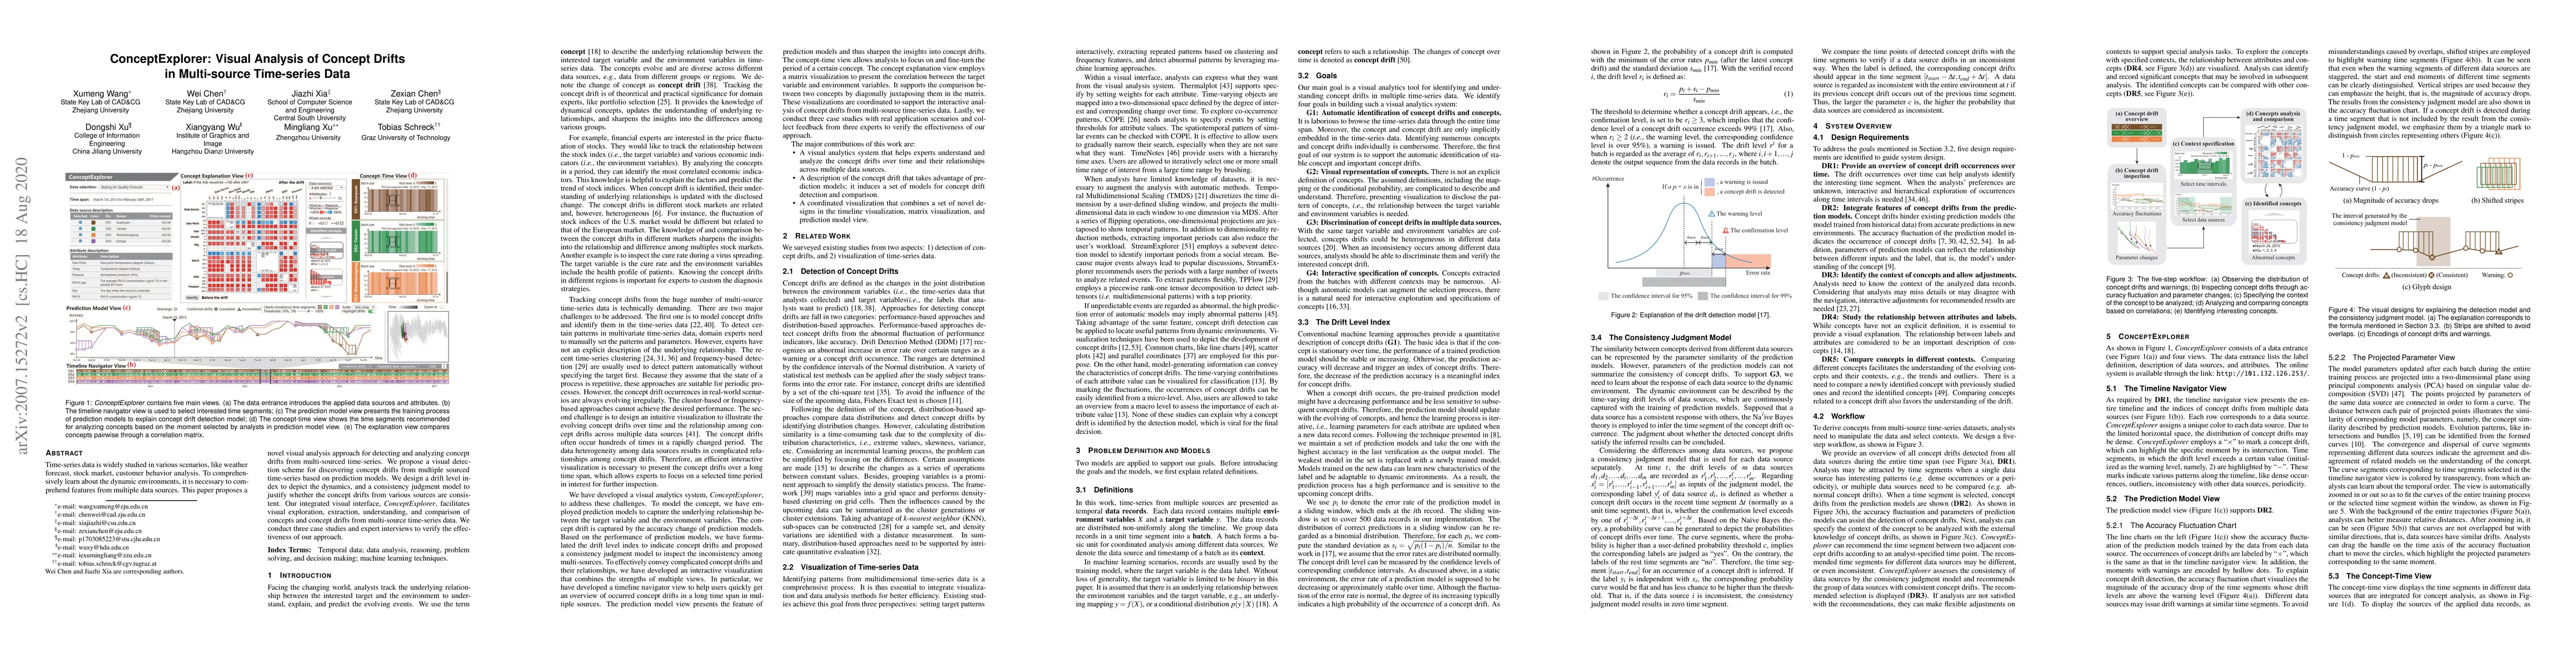
Time-series data is widely studied in various scenarios, like weather forecast, stock market, customer behavior analysis. To comprehensively learn about the dynamic environments, it is necessary to comprehend features from multiple data sources. This paper proposes a novel visual analysis approach for detecting and analyzing concept drifts from multi-sourced time-series. We propose a visual detection scheme for discovering concept drifts from multiple sourced time-series based on prediction models. We design a drift level index to depict the dynamics, and a consistency judgment model to justify whether the concept drifts from various sources are consistent. Our integrated visual interface, ConceptExplorer, facilitates visual exploration, extraction, understanding, and comparison of concepts and concept drifts from multi-source time-series data. We conduct three case studies and expert interviews to verify the effectiveness of our approach.
AI Key Findings
Get AI-generated insights about this paper's methodology, results, significance, and more — seven facets brought into focus.
Impact
Paper Details
PDF Preview
Key Terms
Citation Network
Current paper (gray), citations (green), references (blue)
Display is limited for performance on very large graphs.
Discussion 0