Summary
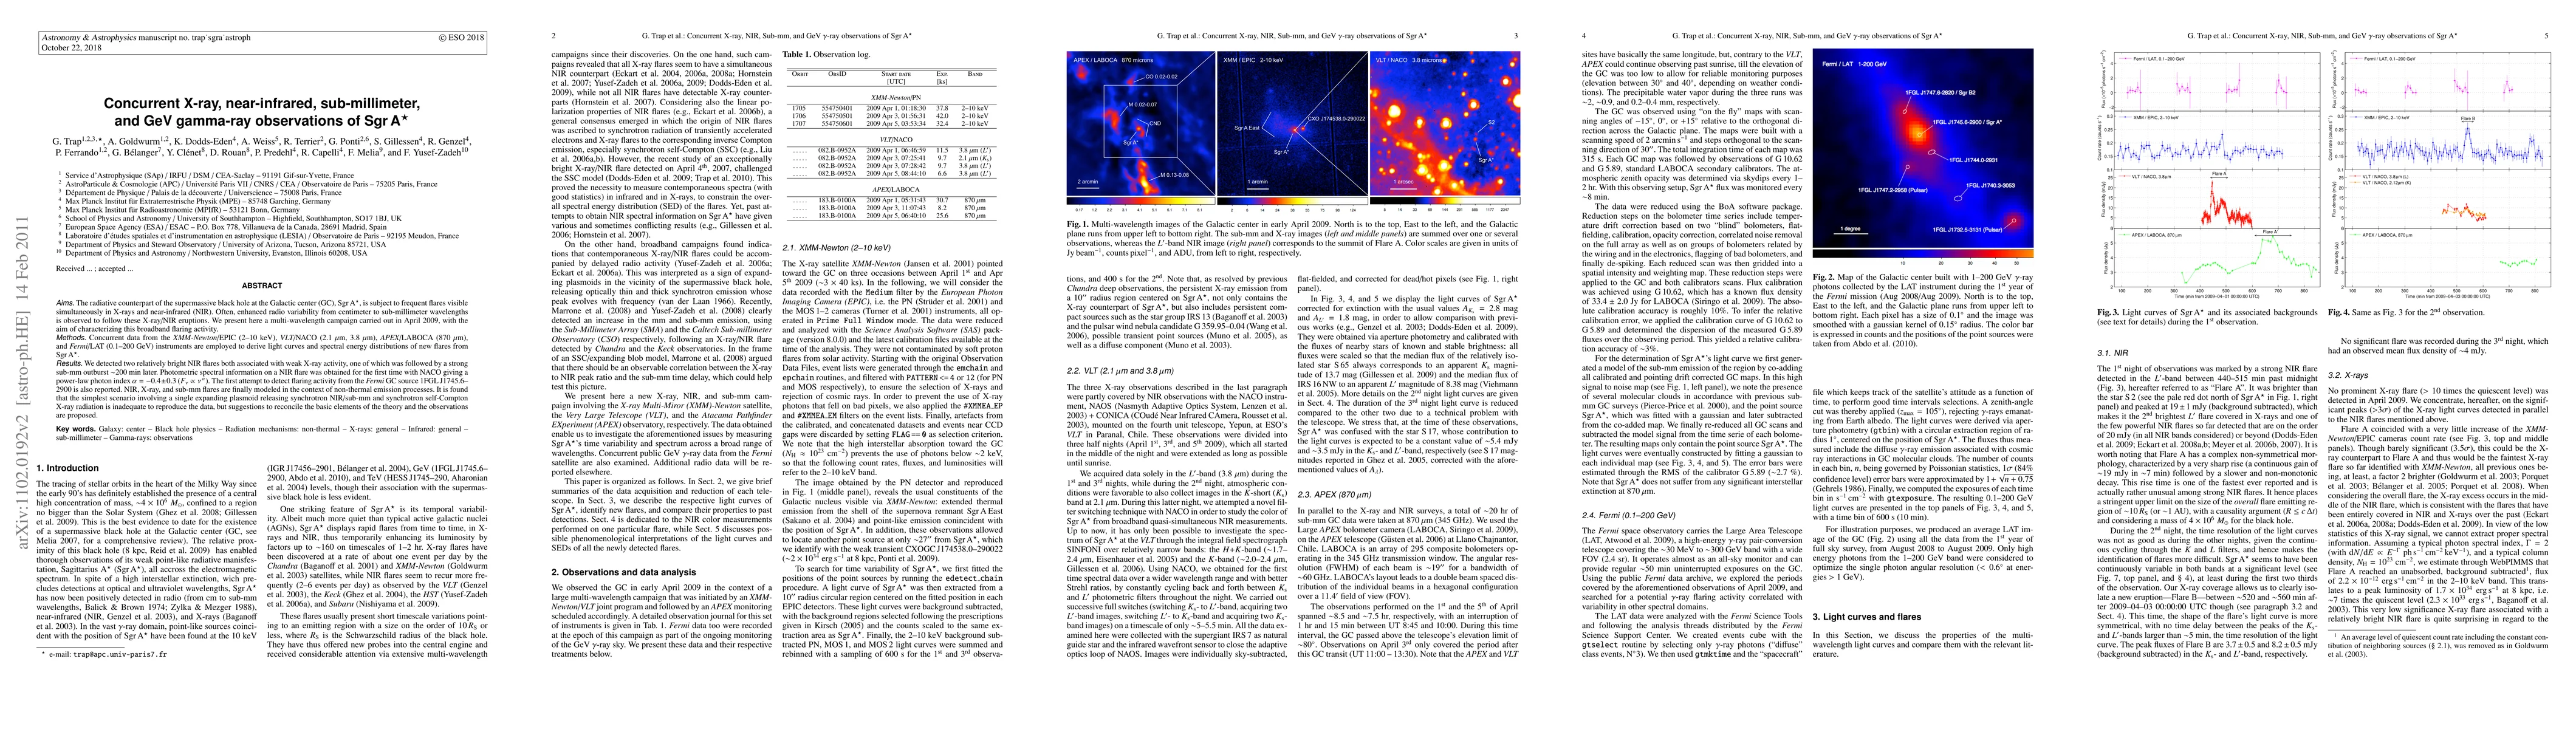
The radiative counterpart of the supermassive black hole at the Galactic center (GC), Sgr A*, is subject to frequent flares visible simultaneously in X-rays and near-infrared (NIR). Often, enhanced radio variability from centimeter to sub-millimeter wavelengths is observed to follow these X-ray/NIR eruptions. We present here a multi-wavelength campaign carried out in April 2009, with the aim of characterizing this broadband flaring activity. Concurrent data from the XMM-Newton/EPIC (2-10 keV), VLT/NACO (2.1 microns, 3.8 microns), APEX/LABOCA (870 microns), and Fermi/LAT (0.1-200 GeV) instruments are employed to derive light curves and spectral energy distributions of new flares from Sgr A*. We detected two relatively bright NIR flares both associated with weak X-ray activity, one of which was followed by a strong sub-mm outburst 200 min later. Photometric spectral information on a NIR flare was obtained for the first time with NACO giving a power-law photon index alpha=-0.4\pm0.3. The first attempt to detect flaring activity from the Fermi GC source 1FGL J1745.6-2900 is also reported. NIR, X-ray, and sub-mm flares are finally modeled in the context of non-thermal emission processes. It is found that the simplest scenario involving a single expanding plasmoid releasing synchrotron NIR/sub-mm and synchrotron self-Compton X-ray radiation is inadequate to reproduce the data, but suggestions to reconcile the basic elements of the theory and the observations are proposed.
AI Key Findings
Get AI-generated insights about this paper's methodology, results, and significance.
Paper Details
PDF Preview
Key Terms
Citation Network
Current paper (gray), citations (green), references (blue)
Display is limited for performance on very large graphs.
| Title | Authors | Year | Actions |
|---|
Comments (0)