Conditional nonparametric variable screening by neural factor regression
Publication
Metrics
AI Quick Summary
This paper proposes a nonparametric variable screening method using neural networks to identify relevant covariates in high-dimensional data with latent factor structures. The method estimates the partial derivative of the regression function to determine additional contributions of predictors beyond latent factors, achieving asymptotic normality and consistency for local alternatives.
Paper Preview
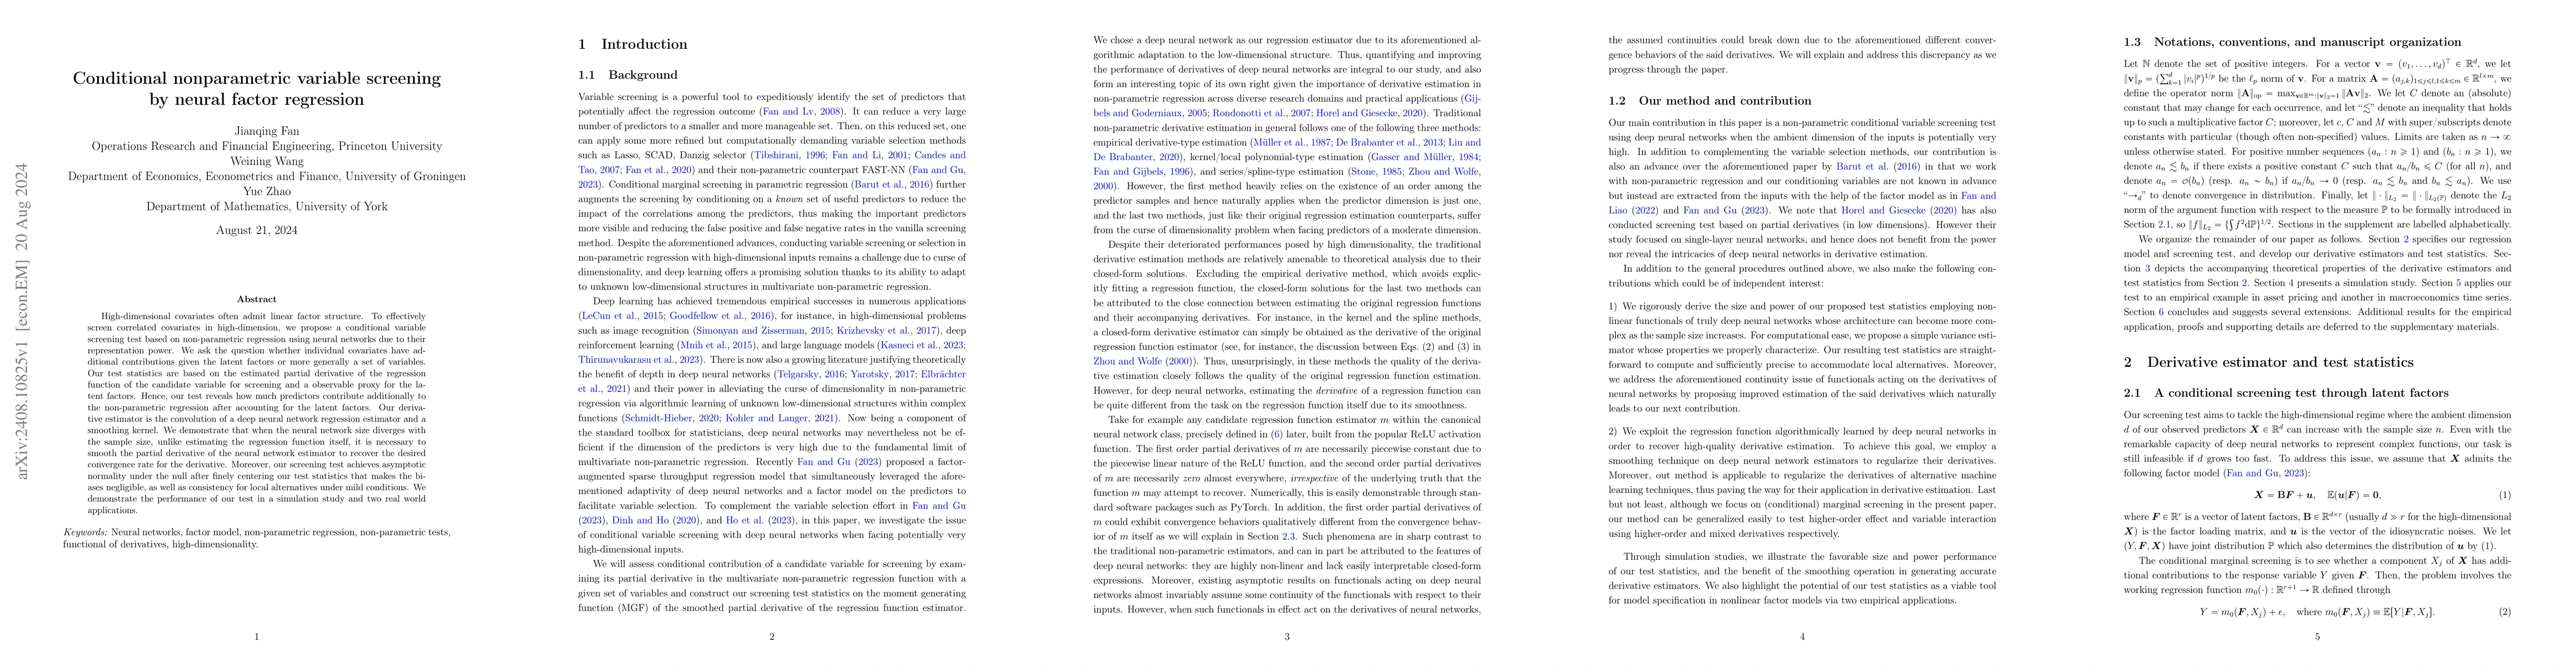
Abstract
High-dimensional covariates often admit linear factor structure. To effectively screen correlated covariates in high-dimension, we propose a conditional variable screening test based on non-parametric regression using neural networks due to their representation power. We ask the question whether individual covariates have additional contributions given the latent factors or more generally a set of variables. Our test statistics are based on the estimated partial derivative of the regression function of the candidate variable for screening and a observable proxy for the latent factors. Hence, our test reveals how much predictors contribute additionally to the non-parametric regression after accounting for the latent factors. Our derivative estimator is the convolution of a deep neural network regression estimator and a smoothing kernel. We demonstrate that when the neural network size diverges with the sample size, unlike estimating the regression function itself, it is necessary to smooth the partial derivative of the neural network estimator to recover the desired convergence rate for the derivative. Moreover, our screening test achieves asymptotic normality under the null after finely centering our test statistics that makes the biases negligible, as well as consistency for local alternatives under mild conditions. We demonstrate the performance of our test in a simulation study and two real world applications.
AI Key Findings
Get AI-generated insights about this paper's methodology, results, significance, and more — seven facets brought into focus.
Paper Details
Authors
PDF Preview
Related Papers
No references found for this paper.
Discussion 0