Publication

Published: Oct 04, 2016
Updated: Jun 08, 2025
Categories: stat.OT

Metrics

Citations: 11
Source: ArXiv

Quick Actions

View PDF

Paper Preview

Abstract

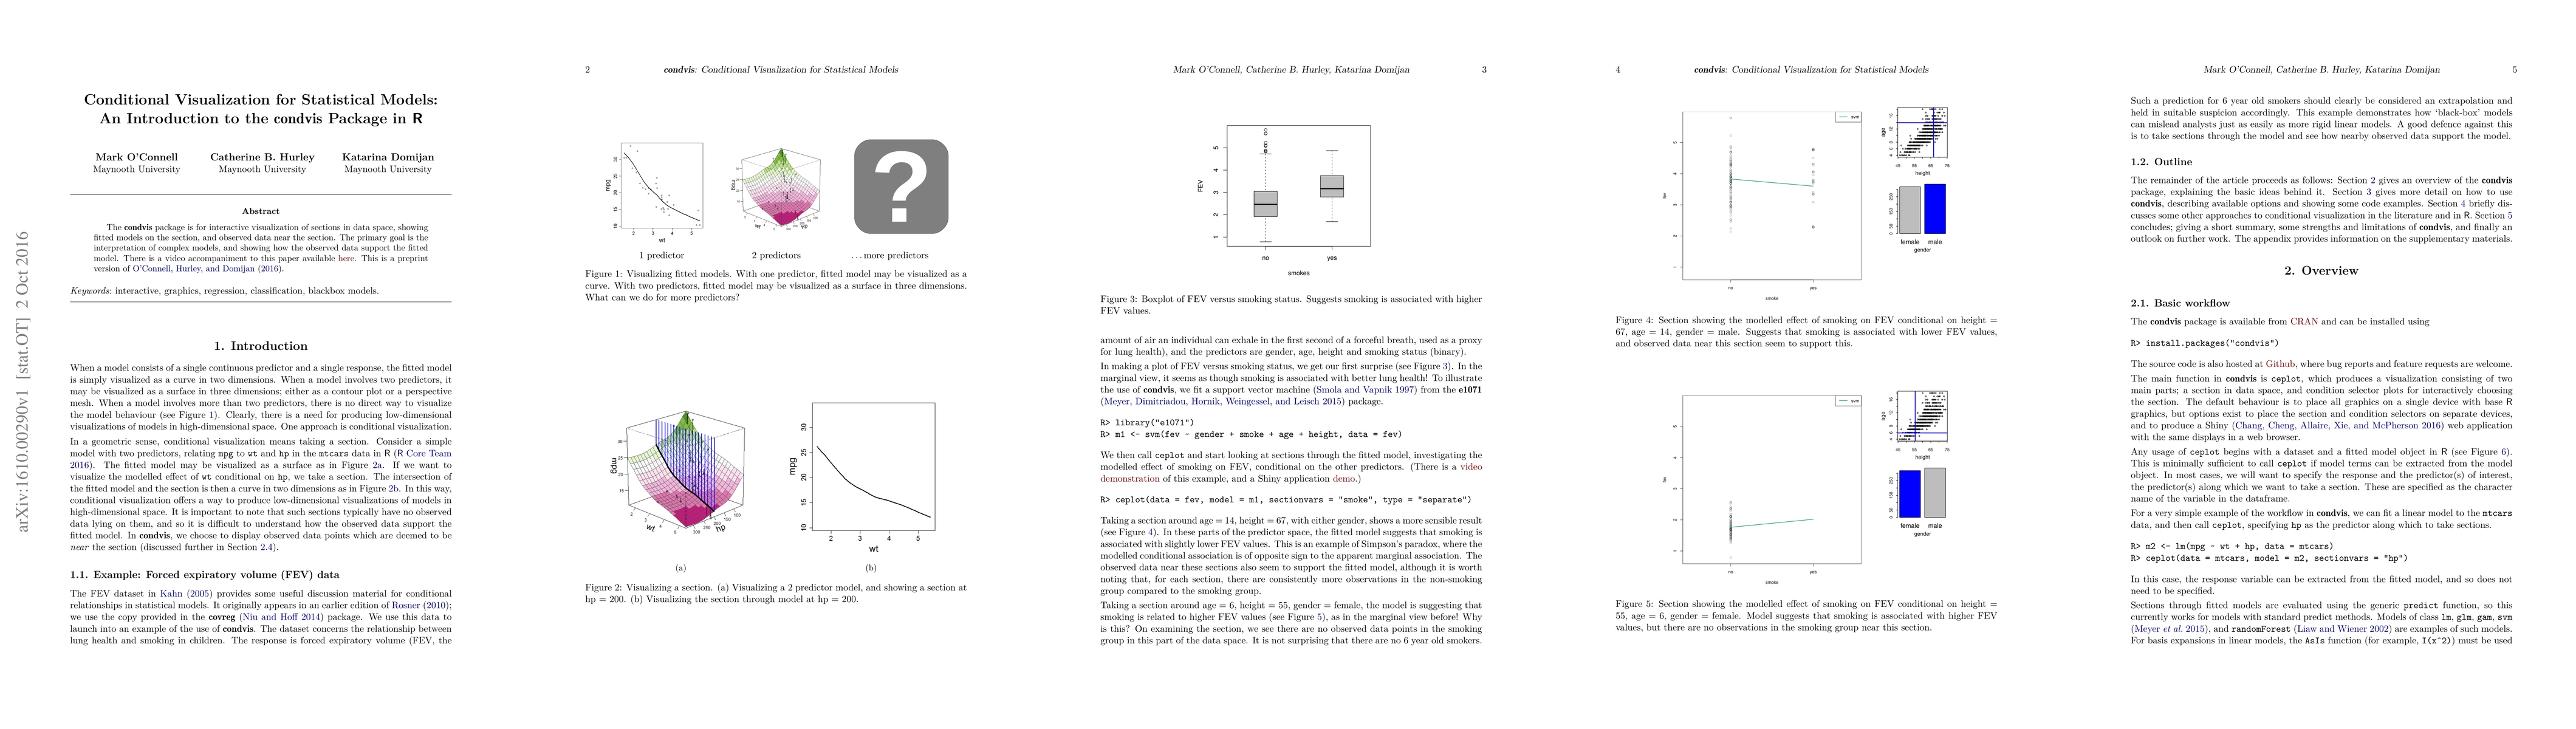
The condvis package is for interactive visualization of sections in data space, showing fitted models on the section, and observed data near the section. The primary goal is the interpretation of complex models, and showing how the observed data support the fitted model. There is a video accompaniment to this paper available at https://www.youtube.com/watch?v=rKFq7xwgdX0. This is a preprint version of an article to appear in the Journal of Statistical Software.

AI Key Findings

Get AI-generated insights about this paper's methodology, results, and significance.

Paper Details

Paper ID: 1610.00290
License: http://creativecommons.org/licenses/by/4.0/
Categories:
stat.OT

How to Cite This Paper

BibTeX
@article{anon2016conditional,
  title         = {Conditional Visualization for Statistical Models: An Introduction to the
  condvis Package in R},
  year          = {2016},
  eprint        = {1610.00290},
  archivePrefix = {arXiv},
  primaryClass  = {stat.OT},
}
APA 7
(2016). Conditional Visualization for Statistical Models: An Introduction to the
  condvis Package in R. arXiv. https://arxiv.org/abs/1610.00290
MLA 9
"Conditional Visualization for Statistical Models: An Introduction to the
  condvis Package in R." arXiv, 2016, arxiv.org/abs/1610.00290.

Key Terms

fitted (0.352)
section (0.301)
section (0.298)
showing (0.291)
showing (0.282)
interactive (0.237)
package (0.235)
visualization (0.233)

Citation Network

Current paper (gray), citations (green), references (blue)

Display is limited for performance on very large graphs.

Current Paper
Citations
References
Click to view
Title Authors Year Actions

Comments (0)

This website uses cookies to ensure you get the best experience. Learn more