Summary
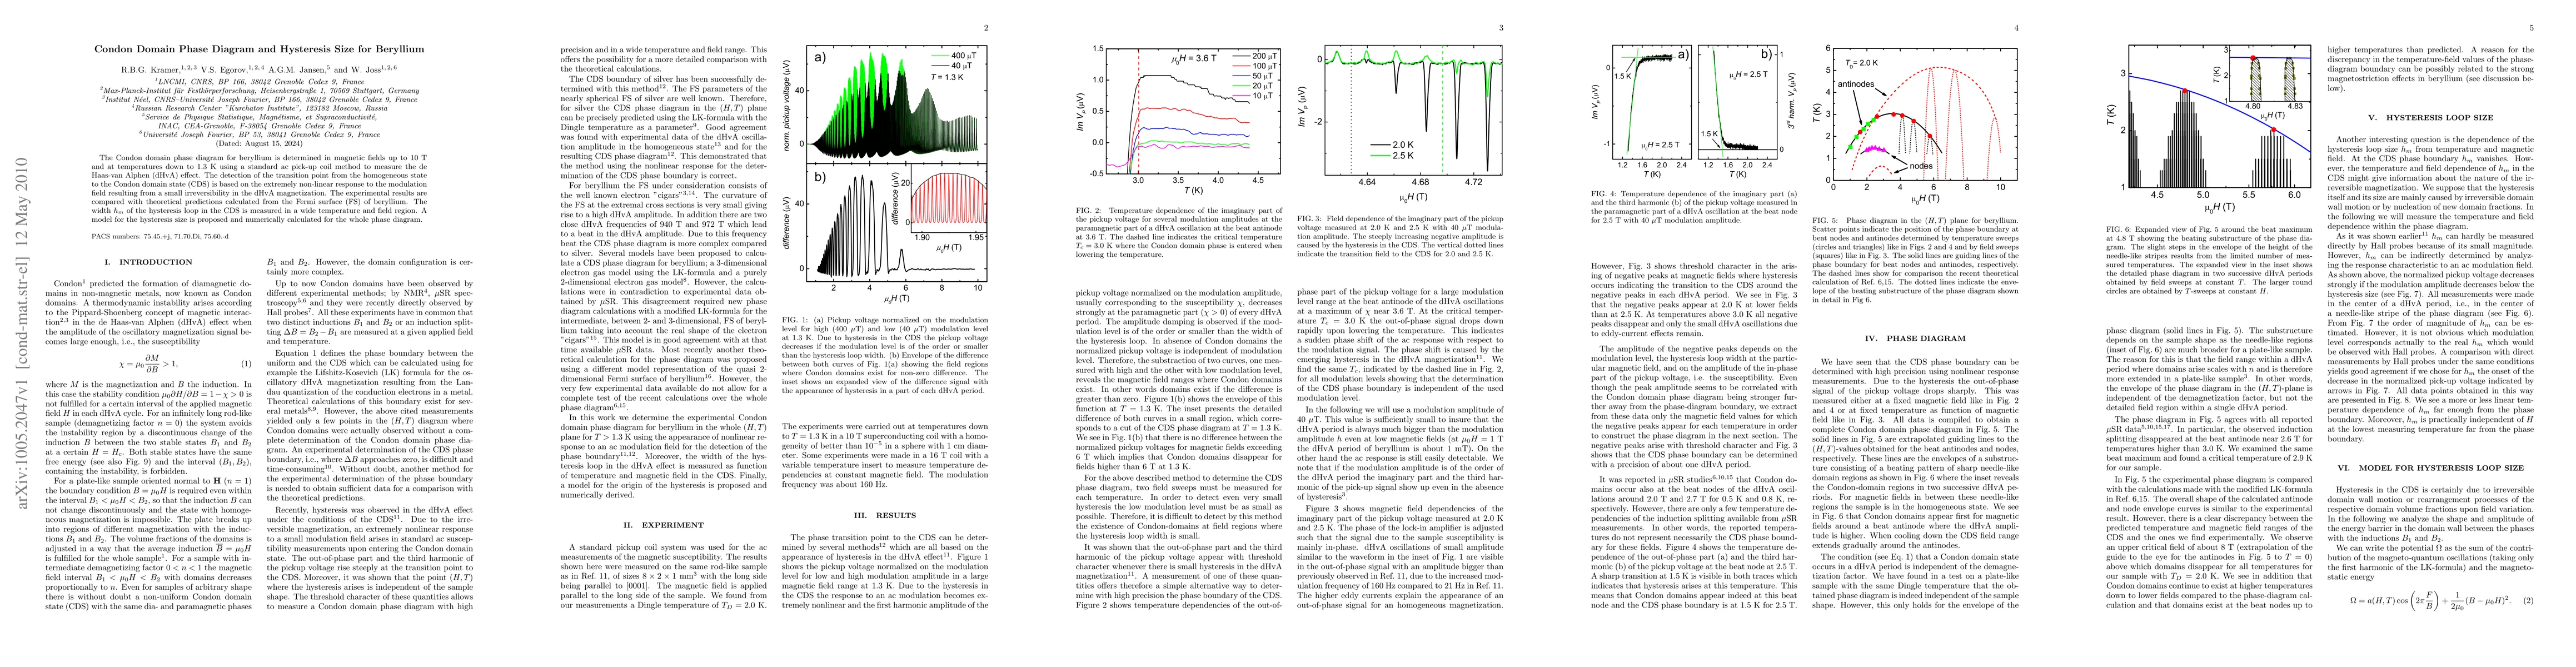
The Condon domain phase diagram for beryllium is determined in magnetic fields up to 10 T and at temperatures down to 1.3 K using a standard ac pick-up coil method to measure the de Haas-van Alphen (dHvA) effect. The detection of the transition point from the homogeneous state to the Condon domain state (CDS) is based on the extremely non-linear response to the modulation field resulting from a small irreversibility in the dHvA magnetization. The experimental results are compared with theoretical predictions calculated from the Fermi surface (FS) of beryllium. The width h_m of the hysteresis loop in the CDS is measured in a wide temperature and field region. A model for the hysteresis size is proposed and numerically calculated for the whole phase diagram.
AI Key Findings
Get AI-generated insights about this paper's methodology, results, and significance.
Paper Details
PDF Preview
Key Terms
Citation Network
Current paper (gray), citations (green), references (blue)
Display is limited for performance on very large graphs.
Similar Papers
Found 4 papers| Title | Authors | Year | Actions |
|---|
Comments (0)