Summary
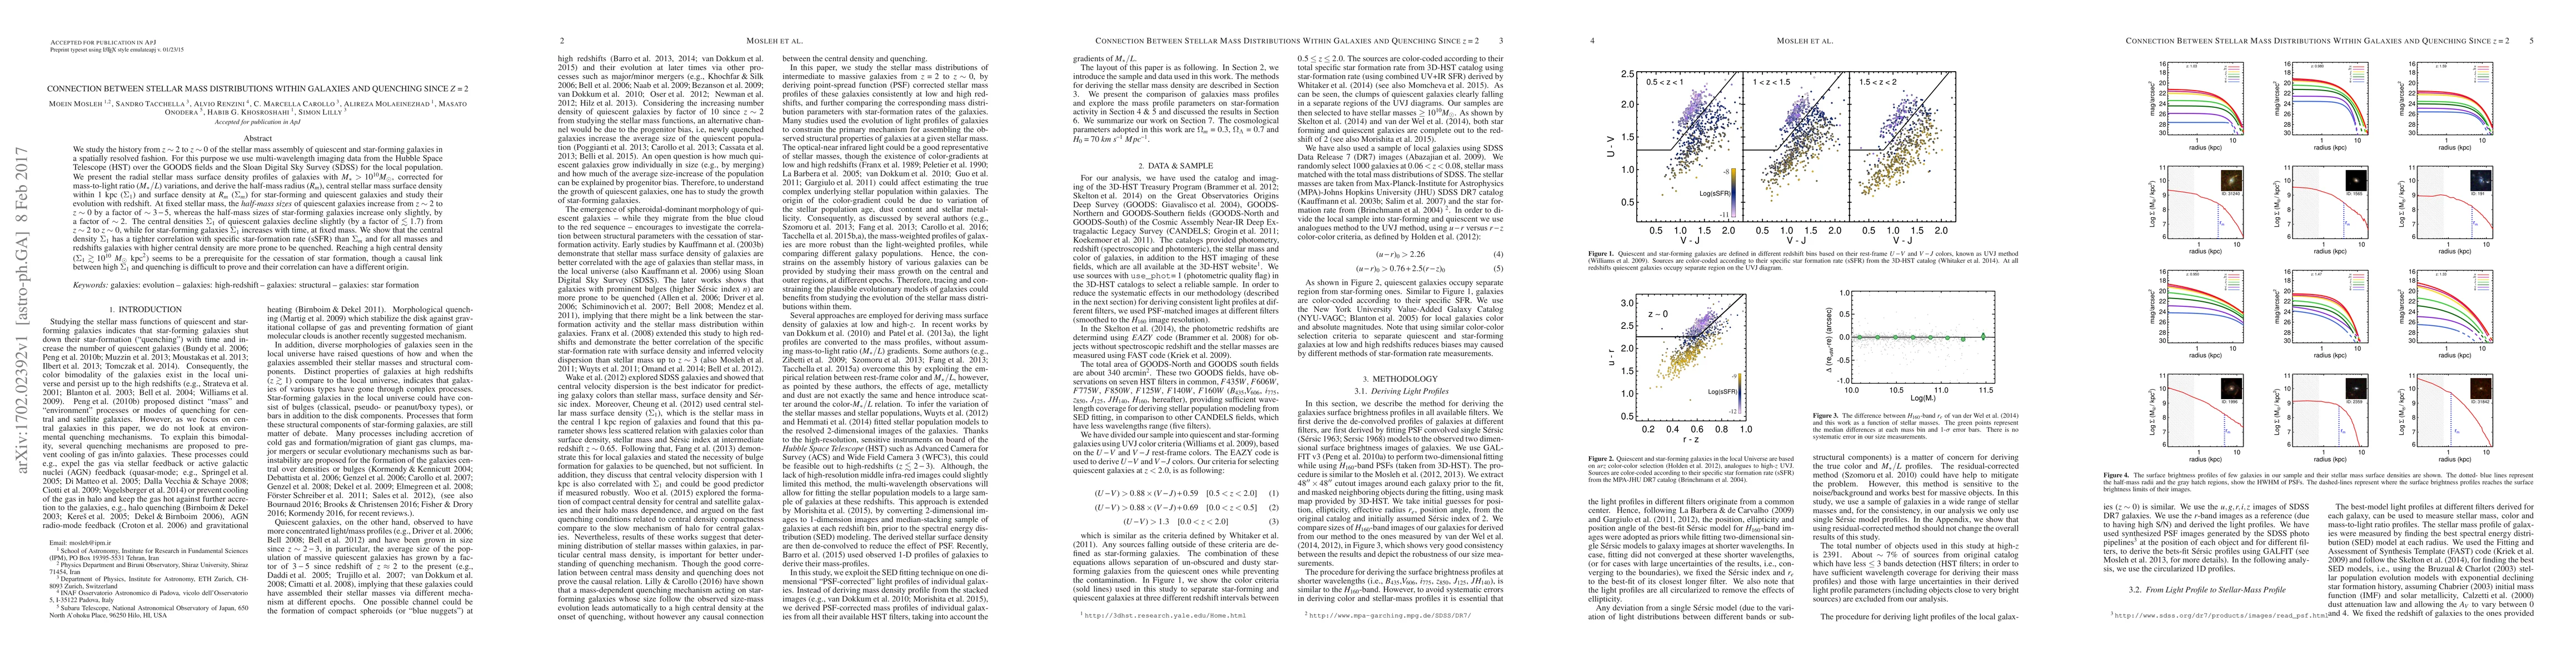
We study the history from $z\sim2$ to $z\sim0$ of the stellar mass assembly of quiescent and star-forming galaxies in a spatially resolved fashion. For this purpose we use multi-wavelength imaging data from the Hubble Space Telescope (HST) over the GOODS fields and the Sloan Digital Sky Survey (SDSS) for the local population. We present the radial stellar mass surface density profiles of galaxies with $M_{\ast}>10^{10} M_{\odot}$, corrected for mass-to-light ratio ($M_{\ast}/L$) variations, and derive the half-mass radius ($R_{m}$), central stellar mass surface density within 1 kpc ($\Sigma_{1}$) and surface density at $R_{m}$ ($\Sigma_{m}$) for star-forming and quiescent galaxies and study their evolution with redshift. At fixed stellar mass, the half-mass sizes of quiescent galaxies increase from $z\sim2$ to $z\sim0$ by a factor of $\sim3-5$, whereas the half-mass sizes of star-forming galaxies increase only slightly, by a factor of $\sim2$. The central densities $\Sigma_{1}$ of quiescent galaxies decline slightly (by a factor of $\lesssim1.7$) from $z\sim2$ to $z\sim0$, while for star-forming galaxies $\Sigma_{1}$ increases with time, at fixed mass. We show that the central density $\Sigma_{1}$ has a tighter correlation with specific star-formation rate (sSFR) than $\Sigma_{m}$ and for all masses and redshifts galaxies with higher central density are more prone to be quenched. Reaching a high central density ($\Sigma_{1} \gtrsim 10^{10} M_{\odot} \mathrm{kpc}^2$) seems to be a prerequisite for the cessation of star formation, though a causal link between high $\Sigma_{1}$ and quenching is difficult to prove and their correlation can have a different origin.
AI Key Findings
Get AI-generated insights about this paper's methodology, results, and significance.
Paper Details
PDF Preview
Key Terms
Citation Network
Current paper (gray), citations (green), references (blue)
Display is limited for performance on very large graphs.
Similar Papers
Found 4 papers| Title | Authors | Year | Actions |
|---|
Comments (0)