Publication
Metrics
AI Quick Summary
This paper develops a new method to analyze high-frequency microlensing variations in strongly lensed quasars, revealing smaller accretion disk sizes and successfully measuring the size of the Broad Line Region (BLR) for the first time using single-band photometric monitoring. The results align with the thin disk model when considering BLR reverberation effects.
Paper Preview
Abstract
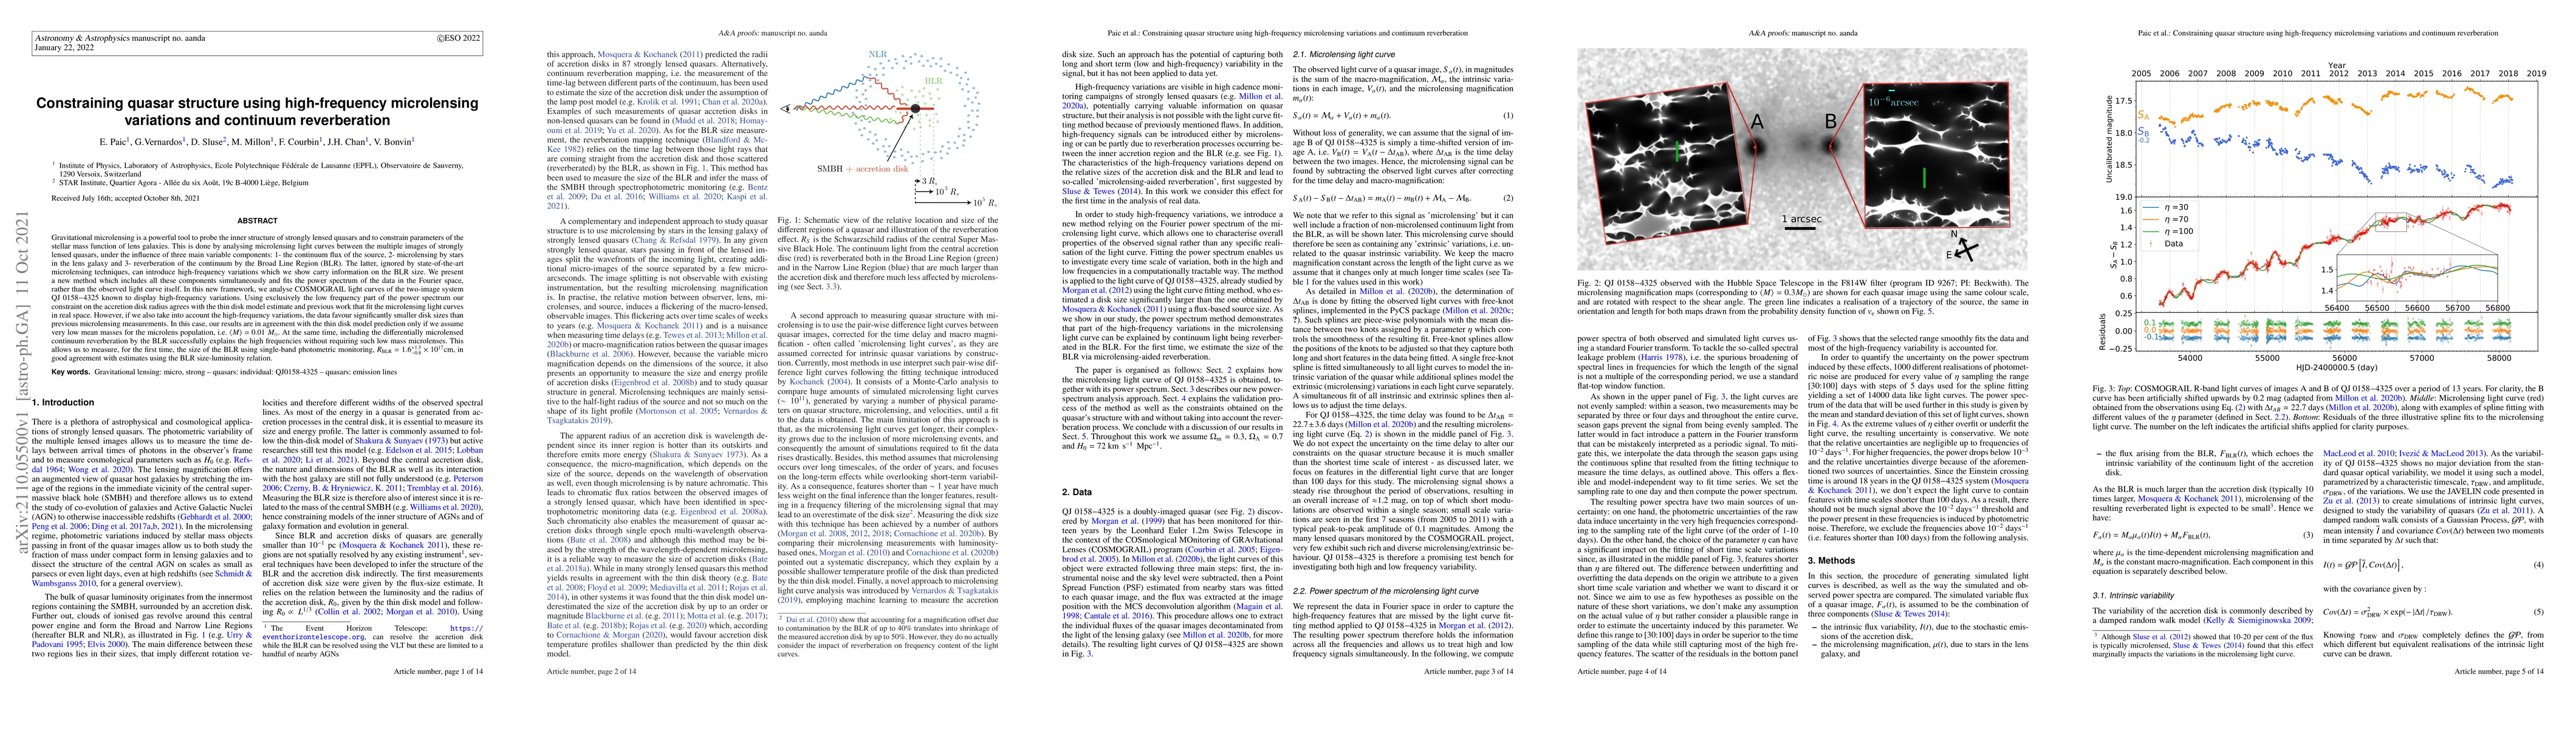
Gravitational microlensing is a powerful tool to probe the inner structure of strongly lensed quasars and to constrain parameters of the stellar mass function of lens galaxies. This is done by analysing microlensing light curves between the multiple images of strongly lensed quasars, under the influence of three main variable components: 1- the continuum flux of the source, 2- microlensing by stars in the lens galaxy and 3- reverberation of the continuum by the Broad Line Region (BLR). The latter, ignored by state-of-the-art microlensing techniques, can introduce high-frequency variations which we show carry information on the BLR size. We present a new method which includes all these components simultaneously and fits the power spectrum of the data in the Fourier space, rather than the observed light curve itself. In this new framework, we analyse COSMOGRAIL light curves of the two-image system QJ0158-4325 known to display high-frequency variations. Using exclusively the low frequency part of the power spectrum our constraint on the accretion disk radius agrees with the thin disk model estimate and previous work that fit the microlensing light curves in real space. However, if we also take into account the high-frequency variations, the data favour significantly smaller disk sizes than previous microlensing measurements. In this case, our results are in agreement with the thin disk model prediction only if we assume very low mean masses for the microlens population, i.e.
AI Key Findings
Get AI-generated insights about this paper's methodology, results, significance, and more — seven facets brought into focus.
Impact
Paper Details
Authors
PDF Preview
Key Terms
Citation Network
Current paper (gray), citations (green), references (blue)
Display is limited for performance on very large graphs.
Discussion 0