Summary
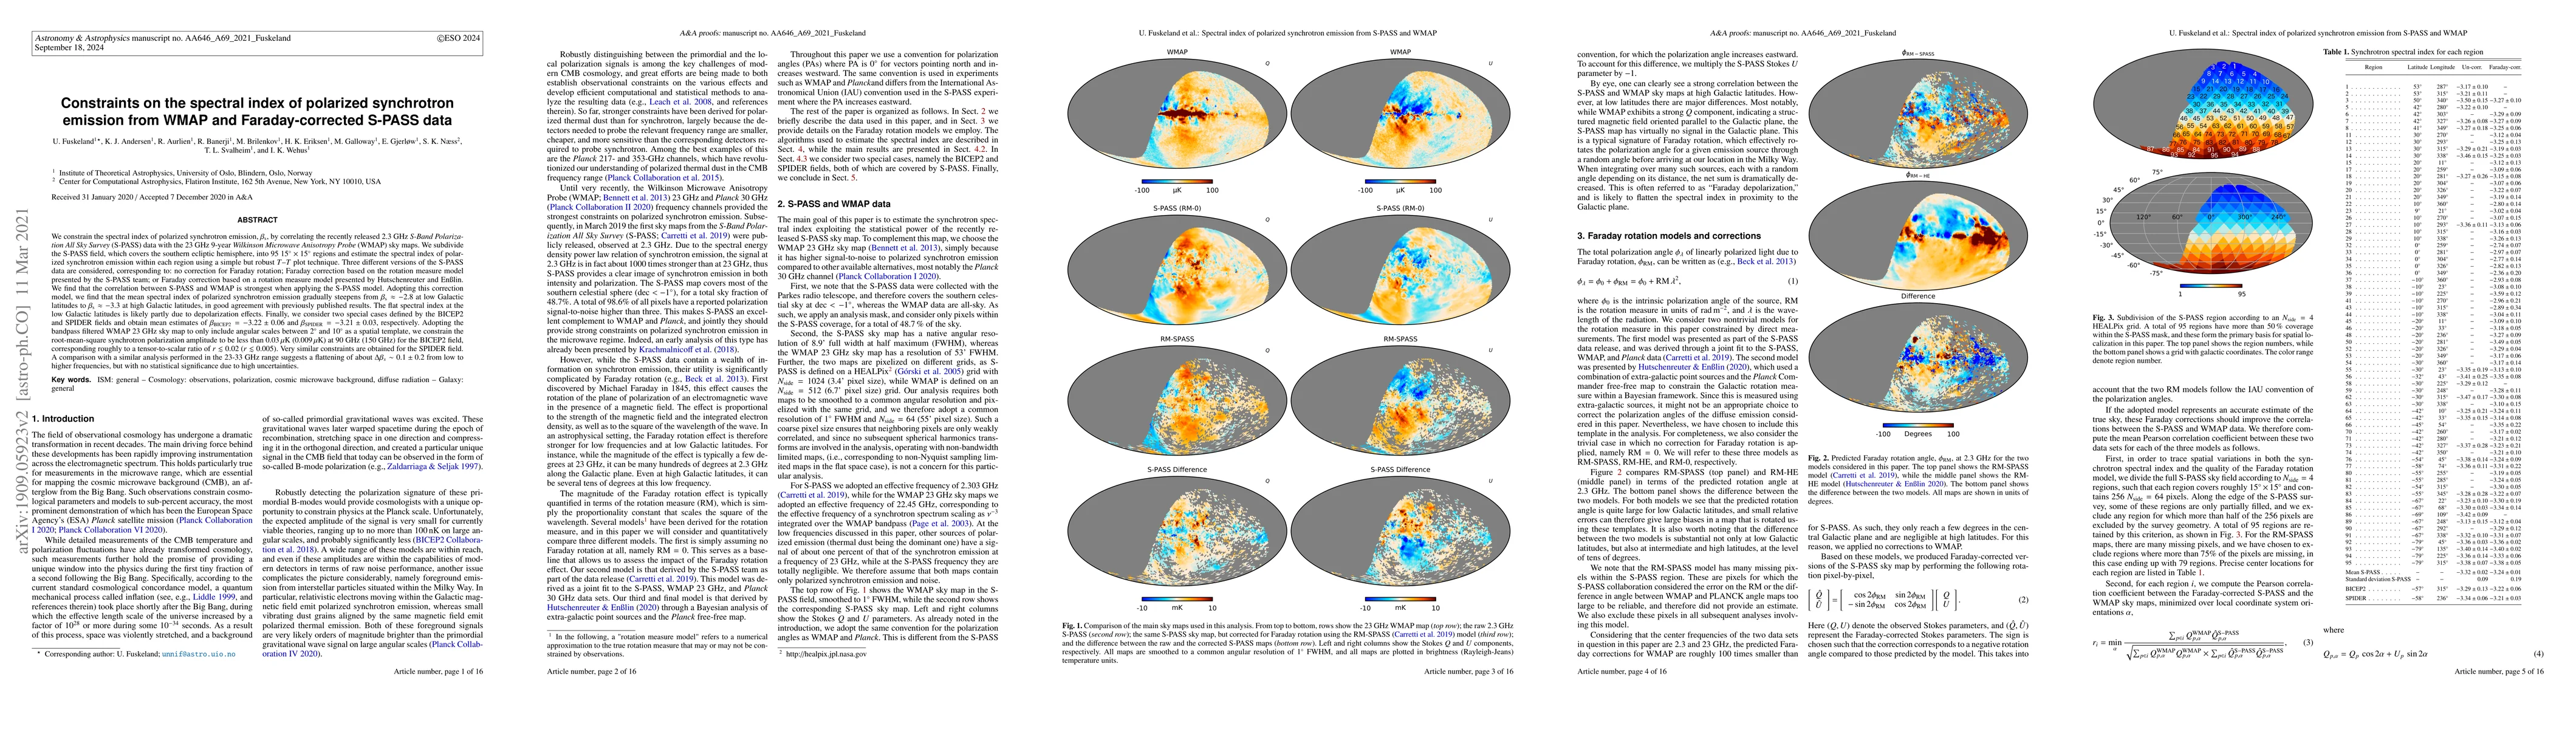
We constrain the spectral index of polarized synchrotron emission, $\beta_s$, by correlating the recently released 2.3 GHz S-Band Polarization All Sky Survey (S-PASS) data with the 23 GHz 9-year Wilkinson Microwave Anisotropy Probe (WMAP) sky maps. We subdivide the S-PASS field, which covers the southern ecliptic hemisphere, into 95 $15^{\circ}\times15^{\circ}$ regions and estimate the spectral index of polarized synchrotron emission within each region using a simple but robust T-T plot technique. Three different versions of the S-PASS data are considered, corresponding to: no correction for Faraday rotation; Faraday correction based on the rotation measure model presented by the S-PASS team; or Faraday correction based on a rotation measure model presented by Hutschenreuter and En{\ss}lin. We find that the correlation between S-PASS and WMAP is strongest when applying the S-PASS model. Adopting this correction model, we find that the mean spectral index of polarized synchrotron emission gradually steepens from $\beta_s\approx-2.8$ at low Galactic latitudes to $\beta_s\approx-3.3$ at high Galactic latitudes, in good agreement with previously published results. Finally, we consider two special cases defined by the BICEP2 and SPIDER fields and obtain mean estimates of $\beta_{BICEP2}=-3.22\pm0.06$ and $\beta_{SPIDER}=-3.21\pm0.03$, respectively. A comparison with a similar analysis performed in the 23-33 GHz range suggests a flattening of about $\Delta\beta_s \sim 0.1 \pm 0.2$ from low to higher frequencies, but with no statistical significance due to high uncertainties.
AI Key Findings
Get AI-generated insights about this paper's methodology, results, and significance.
Paper Details
PDF Preview
Key Terms
Citation Network
Current paper (gray), citations (green), references (blue)
Display is limited for performance on very large graphs.
Similar Papers
Found 4 papersSpatial variations in the spectral index of polarized synchrotron emission in the 9 yr WMAP sky maps
Characterization of the polarized synchrotron emission from Planck and WMAP data
R. B. Barreiro, E. Martínez-González, F. A. Martire
Morphological Analysis of the Polarized Synchrotron Emission with WMAP and Planck
A. J. Banday, R. B. Barreiro, E. Martínez-González et al.
| Title | Authors | Year | Actions |
|---|
Comments (0)