Summary
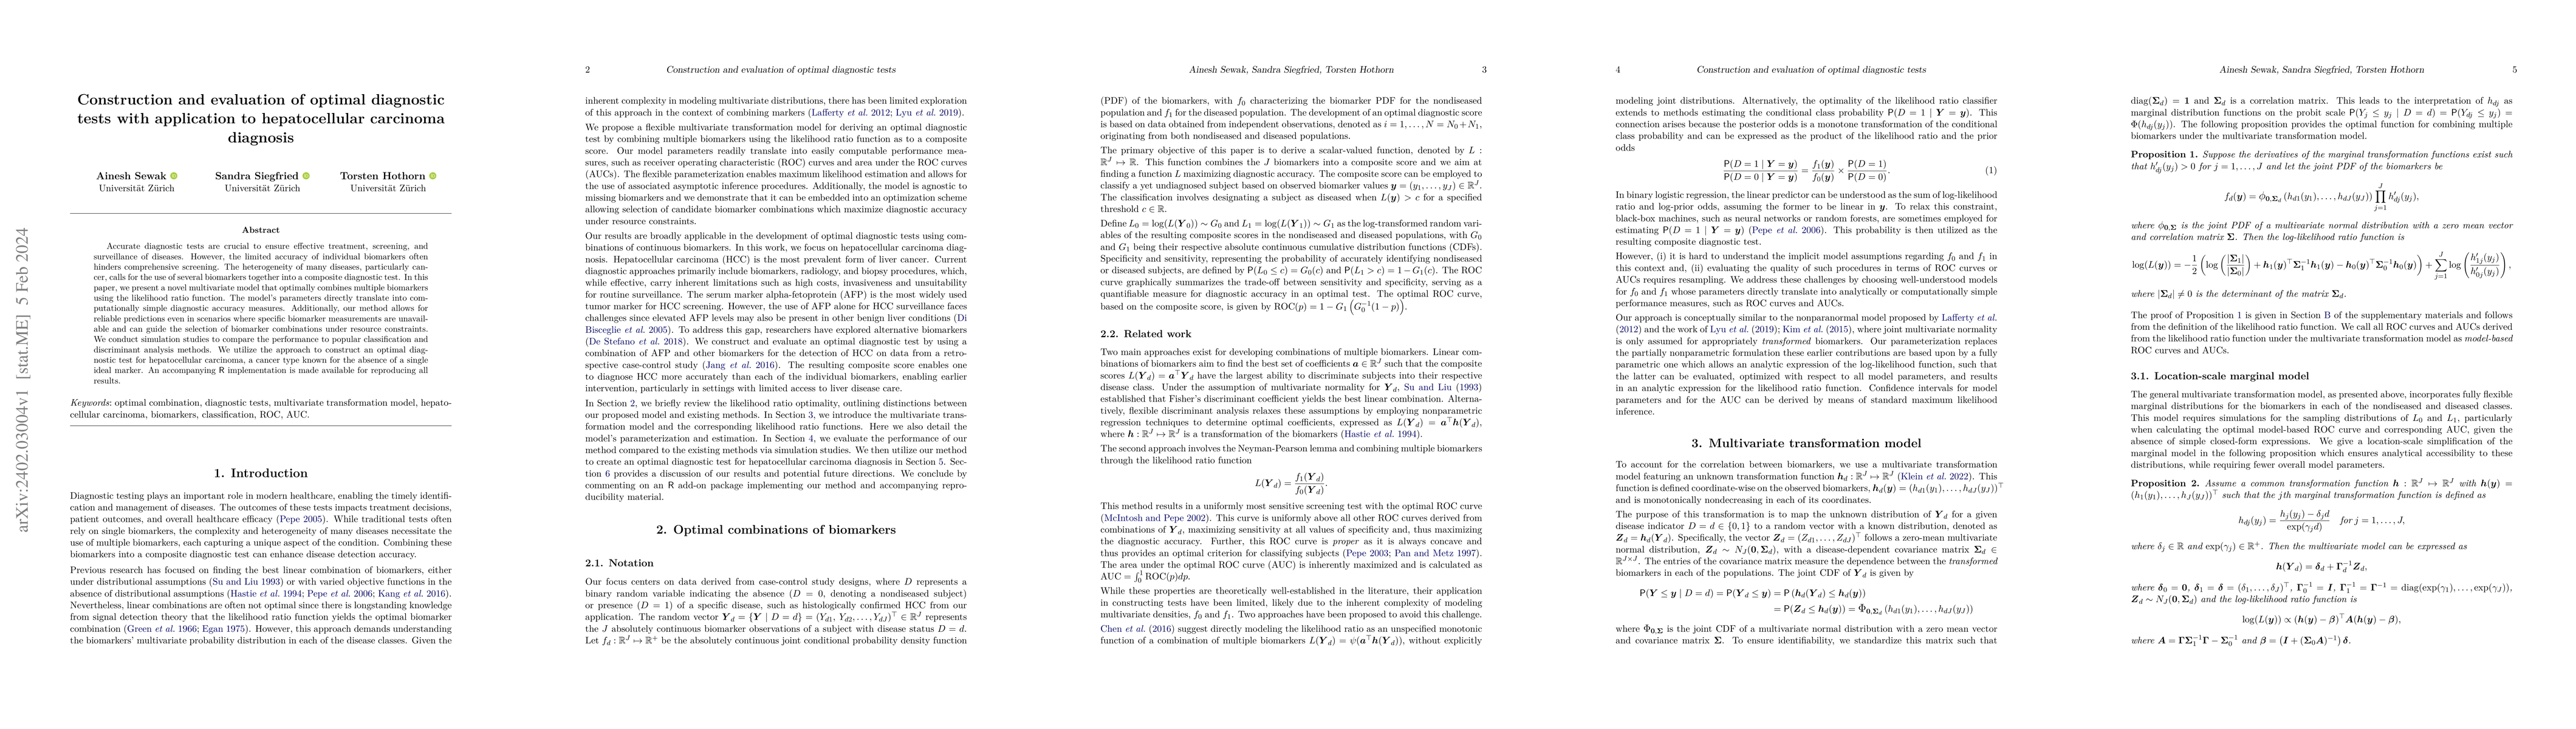
Accurate diagnostic tests are crucial to ensure effective treatment, screening, and surveillance of diseases. However, the limited accuracy of individual biomarkers often hinders comprehensive screening. The heterogeneity of many diseases, particularly cancer, calls for the use of several biomarkers together into a composite diagnostic test. In this paper, we present a novel multivariate model that optimally combines multiple biomarkers using the likelihood ratio function. The model's parameters directly translate into computationally simple diagnostic accuracy measures. Additionally, our method allows for reliable predictions even in scenarios where specific biomarker measurements are unavailable and can guide the selection of biomarker combinations under resource constraints. We conduct simulation studies to compare the performance to popular classification and discriminant analysis methods. We utilize the approach to construct an optimal diagnostic test for hepatocellular carcinoma, a cancer type known for the absence of a single ideal marker. An accompanying R implementation is made available for reproducing all results.
AI Key Findings
Get AI-generated insights about this paper's methodology, results, and significance.
Paper Details
PDF Preview
Key Terms
Citation Network
Current paper (gray), citations (green), references (blue)
Display is limited for performance on very large graphs.
Similar Papers
Found 4 papersEvaluation of serum hsa_tsr014055 as a potential biomarker for diagnosis and prognosis of hepatocellular carcinoma.
Wang, Feng, Xu, Jing, Chen, Lin et al.
Value of threshold growth for the diagnosis of hepatocellular carcinoma using LI-RADS.
Kim, Jae Hyun, Bae, Jae Seok, Lee, Jeong Min et al.
| Title | Authors | Year | Actions |
|---|
Comments (0)