ArxivLens

Publication

Published: Feb 08, 2026
Categories: cs.HC

Metrics

Source: ArXiv

Quick Answers

What methodology did the authors use?

Mixed-design study combining a large-scale online experiment with 60 participants and an in-person think-aloud study with 10 participants, using scatterplots that varied in causal prior strength (strong vs weak) and visual pattern strength (trend vs cluster). More in Methodology →

What are the key results?

Strong causal priors increase the use of causal language and focus participants’ main observations on trend patterns. — Weak causal priors reduce causal language, lower perceived causality, and lead to a more diverse set of pattern observations (trend, cluster, outlier, range). More in Key Results →

Why is this work significant?

The study demonstrates that pre-existing causal beliefs shape how people interpret visual data, influencing both the content of their observations and the trust they place in the data, which has implications for designing visualizations that communicate uncertainty and causal relationships effectively. More in Significance →

What are the main limitations?

Small sample sizes (especially the in-person component) limit generalizability. — The study focused exclusively on scatterplots and on directional causal priors, omitting other chart types and bidirectional or contested priors. More in Limitations →

Paper Preview

Abstract

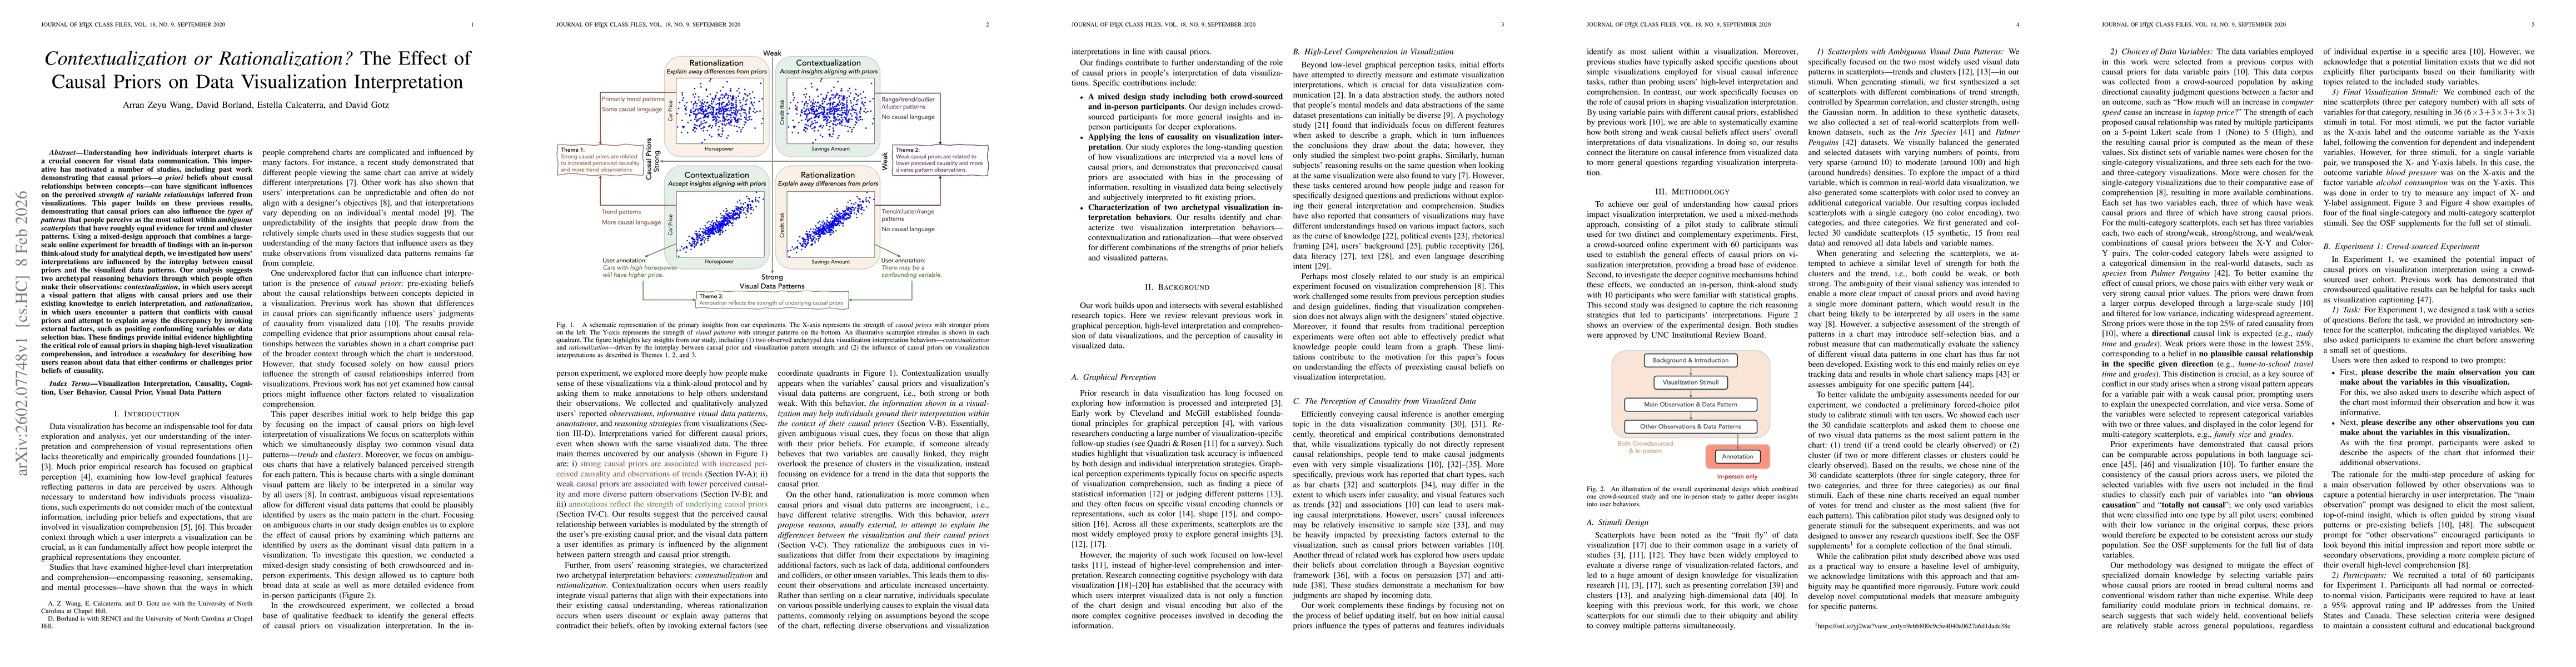
Understanding how individuals interpret charts is a crucial concern for visual data communication. This imperative has motivated a number of studies, including past work demonstrating that causal priors -- a priori beliefs about causal relationships between concepts -- can have significant influences on the perceived strength of variable relationships inferred from visualizations. This paper builds on these previous results, demonstrating that causal priors can also influence the types of patterns that people perceive as the most salient within ambiguous scatterplots that have roughly equal evidence for trend and cluster patterns. Using a mixed-design approach that combines a large-scale online experiment for breadth of findings with an in-person think-aloud study for analytical depth, we investigated how users' interpretations are influenced by the interplay between causal priors and the visualized data patterns. Our analysis suggests two archetypal reasoning behaviors through which people often make their observations: contextualization, in which users accept a visual pattern that aligns with causal priors and use their existing knowledge to enrich interpretation, and rationalization, in which users encounter a pattern that conflicts with causal priors and attempt to explain away the discrepancy by invoking external factors, such as positing confounding variables or data selection bias. These findings provide initial evidence highlighting the critical role of causal priors in shaping high-level visualization comprehension, and introduce a vocabulary for describing how users reason about data that either confirms or challenges prior beliefs of causality.

Key Findings, in focus

Seven facets of this paper, analysed and brought into focus by AI.

AI-generated · verify against source Generated Feb 13, 2026
In focus · one-line synthesis

The study demonstrates that pre-existing causal beliefs shape how people interpret visual data, influencing both the content of their observations and the trust they place in the data, which has implications for designing visualizations that communicate uncertainty and causal relationships effectively.

01
MethodologyHow they did it

Mixed-design study combining a large-scale online experiment with 60 participants and an in-person think-aloud study with 10 participants, using scatterplots that varied in causal prior strength (strong vs weak) and visual pattern strength (trend vs cluster).

02
ResultsWhat they found
  • Strong causal priors increase the use of causal language and focus participants’ main observations on trend patterns.
  • Weak causal priors reduce causal language, lower perceived causality, and lead to a more diverse set of pattern observations (trend, cluster, outlier, range).
  • Participants’ reasoning strategies cluster into two archetypes—contextualization (accepting patterns that align with priors) and rationalization (rejecting conflicting patterns)—and these strategies depend on the alignment between prior strength and visual pattern strength.
03
SignificanceWhy it matters

The study demonstrates that pre-existing causal beliefs shape how people interpret visual data, influencing both the content of their observations and the trust they place in the data, which has implications for designing visualizations that communicate uncertainty and causal relationships effectively.

04
Technical ContributionsWhat's new technically

Identification and formalization of two reasoning behaviors—contextualization and rationalization—linked to causal prior strength, and a mapping of annotation styles to prior strength, providing a framework for analyzing high-level visualization interpretation.

05
NoveltyWhat sets it apart

First systematic investigation of how causal priors influence both the linguistic framing of observations and the reasoning strategies used in interpreting ambiguous scatterplots, bridging causal inference theory with visualization comprehension research.

06
LimitationsWhat to be cautious about
  • Small sample sizes (especially the in-person component) limit generalizability.
  • The study focused exclusively on scatterplots and on directional causal priors, omitting other chart types and bidirectional or contested priors.
07
Future WorkWhere it goes next
  • Conduct larger, more diverse studies including additional chart types (bar, line, heatmaps) to test the generality of the findings.
  • Incorporate individualized causal priors and measures of belief uncertainty to explore how personal conviction modulates contextualization and rationalization.

Paper Details

Paper ID: 2602.07748
Categories:
cs.HC

How to Cite This Paper

Reference manager: RIS EndNote


Discussion 0

This website uses cookies to ensure you get the best experience. Learn more