Contextualizing E-values for Interpretable Sensitivity to Unmeasured Confounding Analyses
Publication
Metrics
AI Quick Summary
This paper proposes the Observed Covariate E-value to contextualize sensitivity analyses for unmeasured confounding in observational studies, comparing hypothetical E-values against the actual impact of observed covariates. It introduces a visual sensitivity analysis figure to facilitate easy comparison of these values.
Paper Preview
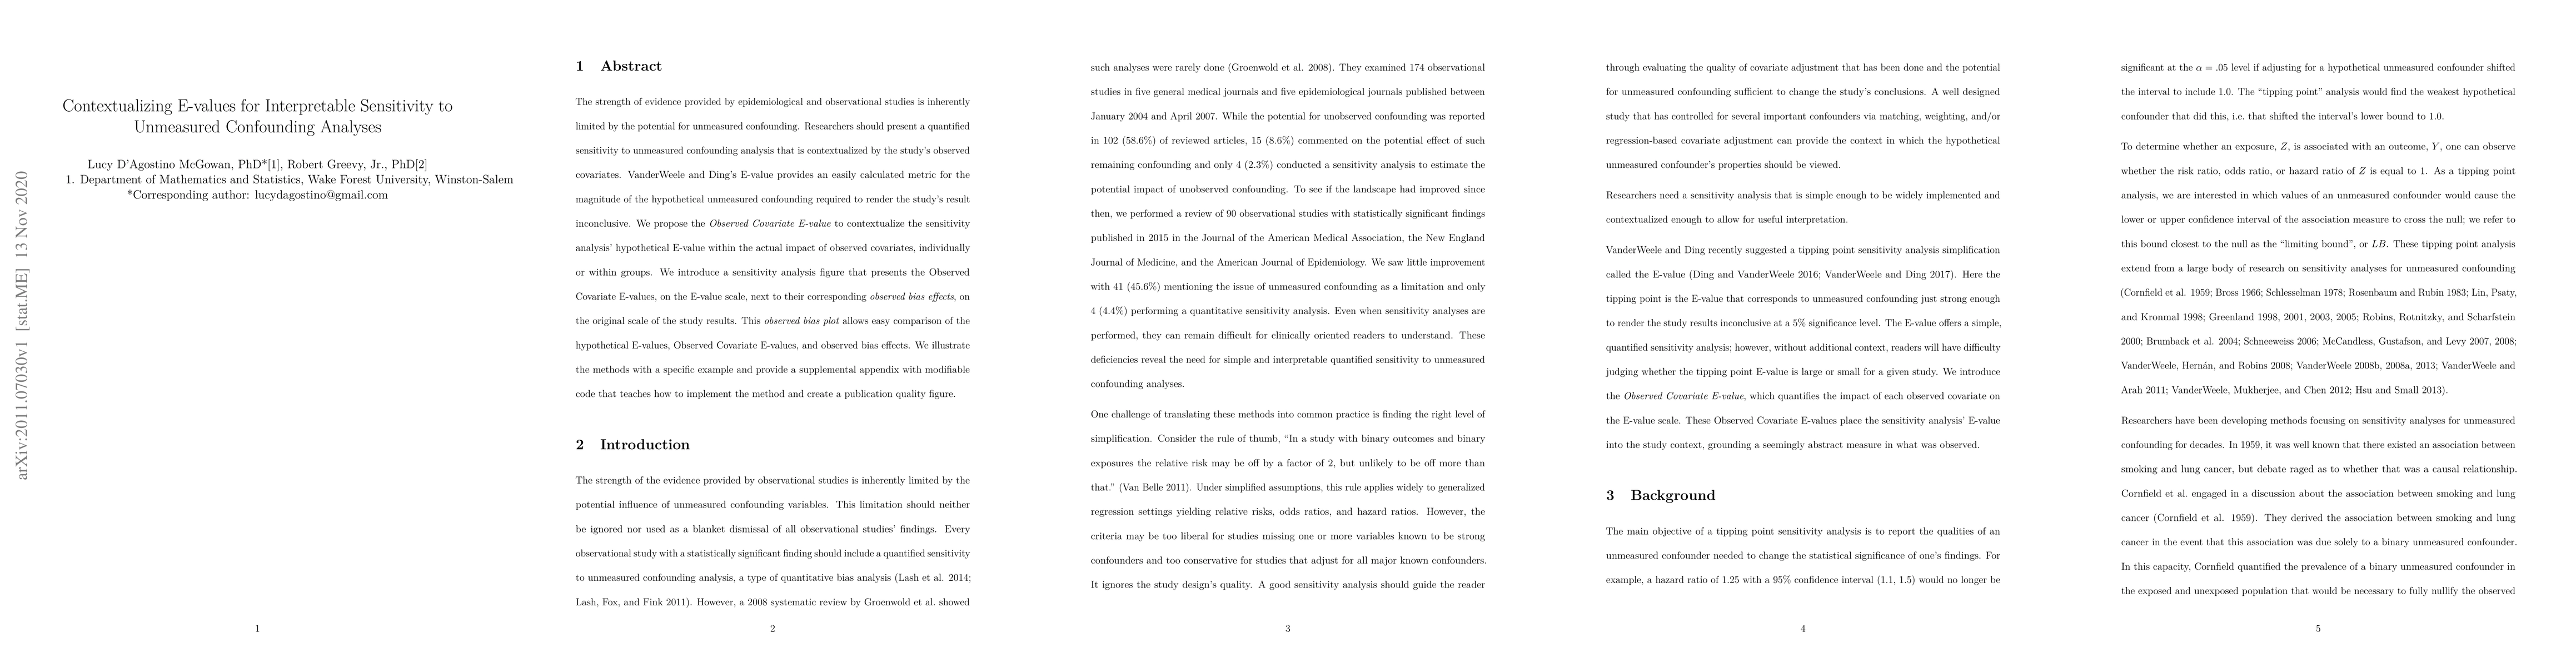
Abstract
The strength of evidence provided by epidemiological and observational studies is inherently limited by the potential for unmeasured confounding. Researchers should present a quantified sensitivity to unmeasured confounding analysis that is contextualized by the study's observed covariates. VanderWeele and Ding's E-value provides an easily calculated metric for the magnitude of the hypothetical unmeasured confounding required to render the study's result inconclusive. We propose the Observed Covariate E-value to contextualize the sensitivity analysis' hypothetical E-value within the actual impact of observed covariates, individually or within groups. We introduce a sensitivity analysis figure that presents the Observed Covariate E-values, on the E-value scale, next to their corresponding observed bias effects, on the original scale of the study results. This observed bias plot allows easy comparison of the hypothetical E-values, Observed Covariate E-values, and observed bias effects. We illustrate the methods with a specific example and provide a supplemental appendix with modifiable code that teaches how to implement the method and create a publication quality figure.
AI Key Findings
Get AI-generated insights about this paper's methodology, results, significance, and more — seven facets brought into focus.
Impact
Paper Details
Authors
PDF Preview
Key Terms
Citation Network
Current paper (gray), citations (green), references (blue)
Display is limited for performance on very large graphs.
Discussion 0