Continual Deterioration Prediction for Hospitalized COVID-19 Patients
Publication
Metrics
AI Quick Summary
This paper develops a temporal stratification approach to predict the continual deterioration of hospitalized COVID-19 patients, showing promising preliminary results with high AUROC, F1 score, and AUPR. It verifies that clinical variables have varying effects on patient outcomes at different disease stages.
Paper Preview
Abstract
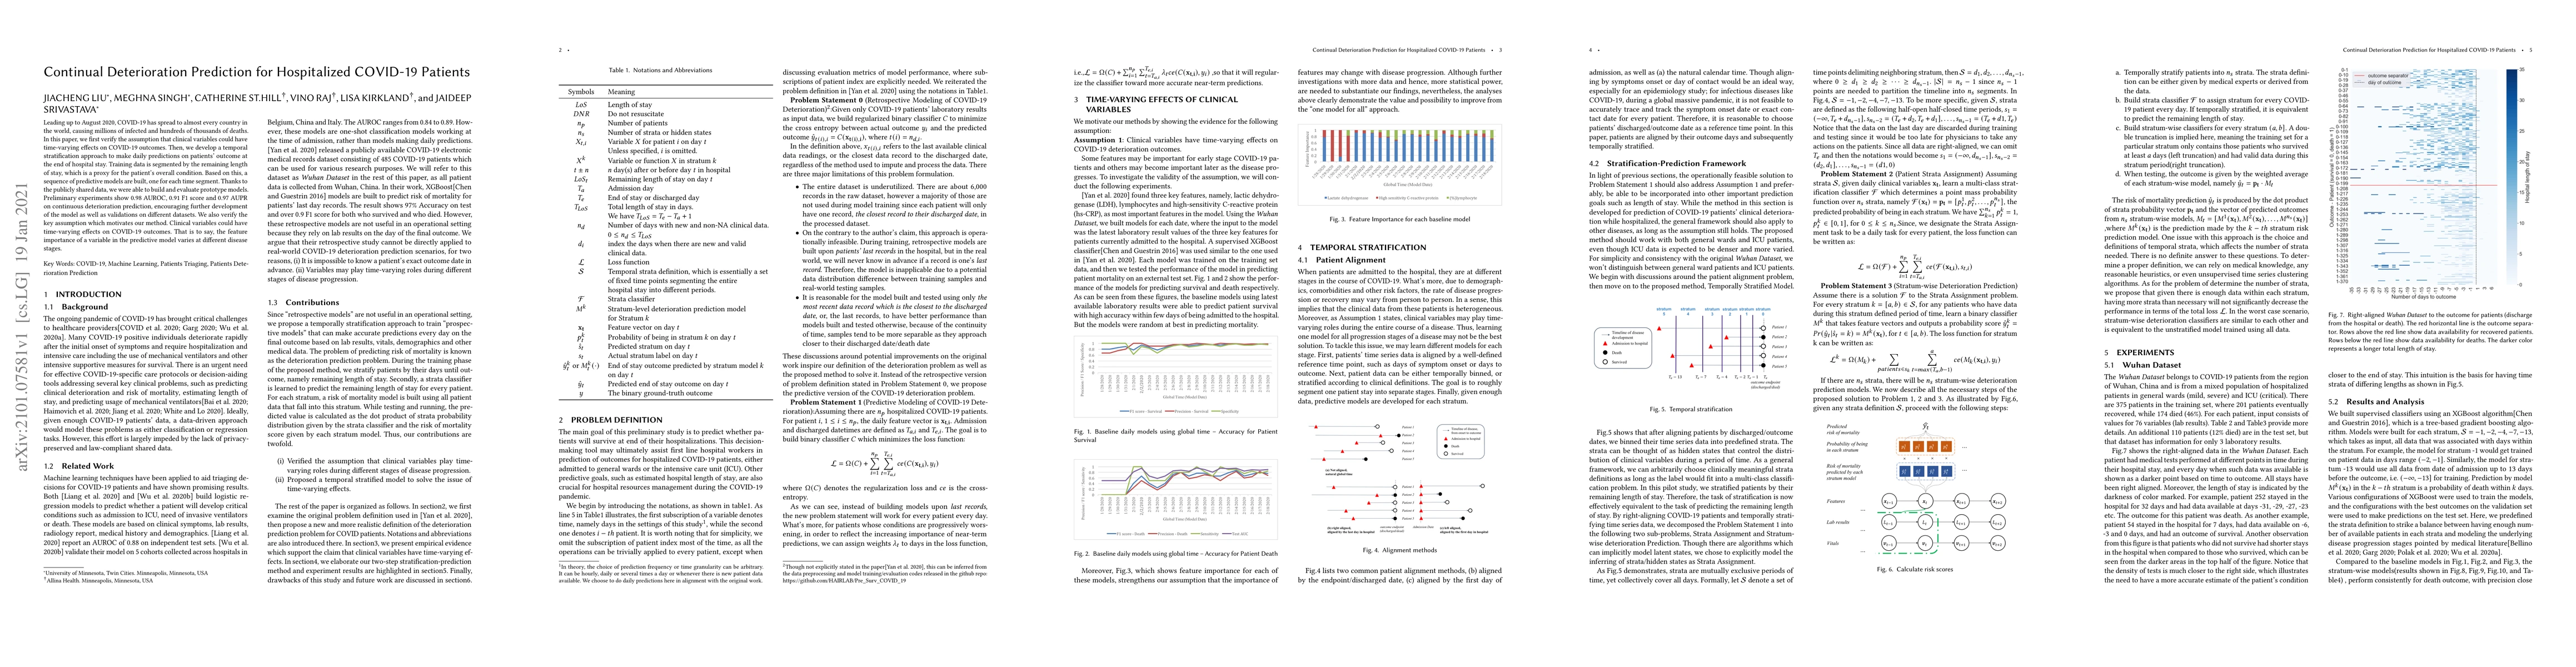
Leading up to August 2020, COVID-19 has spread to almost every country in the world, causing millions of infected and hundreds of thousands of deaths. In this paper, we first verify the assumption that clinical variables could have time-varying effects on COVID-19 outcomes. Then, we develop a temporal stratification approach to make daily predictions on patients' outcome at the end of hospital stay. Training data is segmented by the remaining length of stay, which is a proxy for the patient's overall condition. Based on this, a sequence of predictive models are built, one for each time segment. Thanks to the publicly shared data, we were able to build and evaluate prototype models. Preliminary experiments show 0.98 AUROC, 0.91 F1 score and 0.97 AUPR on continuous deterioration prediction, encouraging further development of the model as well as validations on different datasets. We also verify the key assumption which motivates our method. Clinical variables could have time-varying effects on COVID-19 outcomes. That is to say, the feature importance of a variable in the predictive model varies at different disease stages.
AI Key Findings
Get AI-generated insights about this paper's methodology, results, significance, and more — seven facets brought into focus.
Impact
Paper Details
Authors
PDF Preview
Key Terms
Citation Network
Current paper (gray), citations (green), references (blue)
Display is limited for performance on very large graphs.
Discussion 0