Continuum Reverberation Mapping of Mrk 876 Over Three Years With Remote Robotic Observatories
Publication
Metrics
AI Quick Summary
This study uses continuum reverberation mapping over three years to investigate the optical continuum-emitting region of the AGN Mrk 876, revealing significant variability and interband lags of around 13 days from $u$ to $z$. The lags are longer than expected, suggesting a factor of 3 discrepancy, and an excess lag in the $i$ band is attributed to variable H$\alpha$ emission.
Paper Preview
Abstract
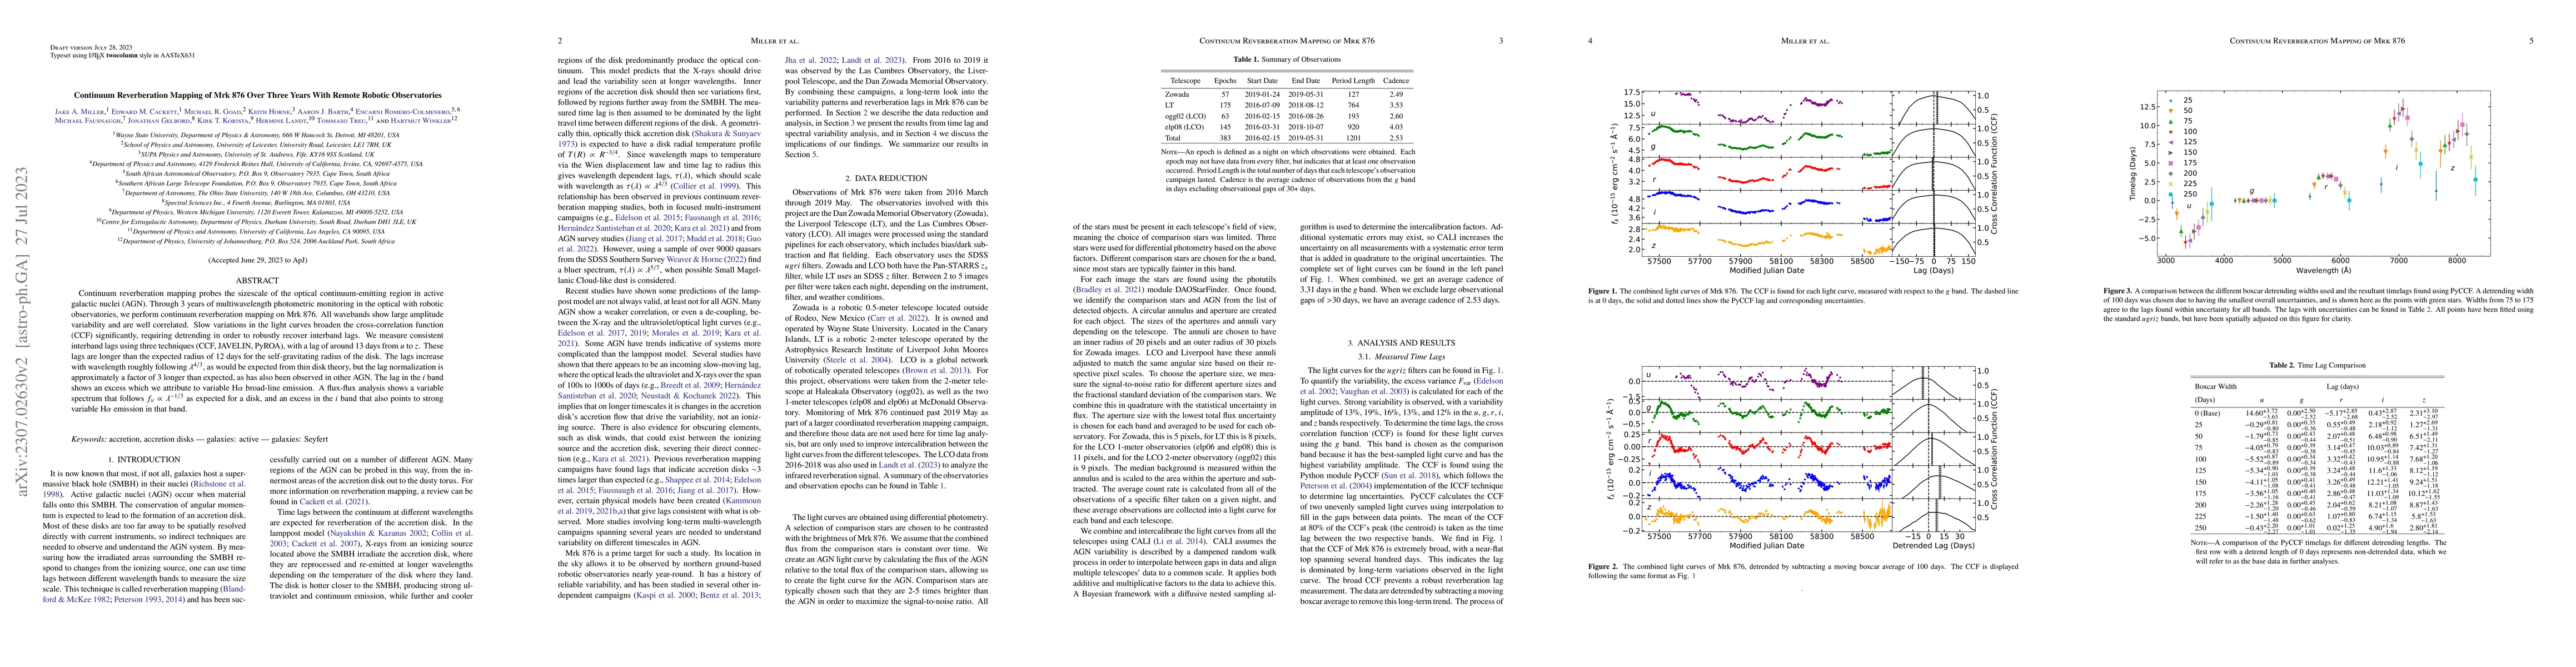
Continuum reverberation mapping probes the sizescale of the optical continuum-emitting region in active galactic nuclei (AGN). Through 3 years of multiwavelength photometric monitoring in the optical with robotic observatories, we perform continuum reverberation mapping on Mrk~876. All wavebands show large amplitude variability and are well correlated. Slow variations in the light curves broaden the cross-correlation function (CCF) significantly, requiring detrending in order to robustly recover interband lags. We measure consistent interband lags using three techniques (CCF, JAVELIN, PyROA), with a lag of around 13~days from $u$ to $z$. These lags are longer than the expected radius of 12~days for the self-gravitating radius of the disk. The lags increase with wavelength roughly following $\lambda^{4/3}$, as would be expected from thin disk theory, but the lag normalization is approximately a factor of 3 longer than expected, as has also been observed in other AGN. The lag in the $i$ band shows an excess which we attribute to variable H$\alpha$ broad-line emission. A flux-flux analysis shows a variable spectrum that follows $f_\nu \propto \lambda^{-1/3}$ as expected for a disk, and an excess in the $i$ band that also points to strong variable H$\alpha$ emission in that band.
AI Key Findings
Get AI-generated insights about this paper's methodology, results, significance, and more — seven facets brought into focus.
Impact
Paper Details
Authors
PDF Preview
Key Terms
Citation Network
Current paper (gray), citations (green), references (blue)
Display is limited for performance on very large graphs.
Discussion 0