Contour map of estimation error for Expected Shortfall

PDF

Publication

Published: Feb 24, 2015
Categories: q-fin.RM, q-fin.PM

Metrics

Source: ArXiv

Quick Actions

View PDF

AI Quick Summary

This paper constructs a contour map of estimation error for Expected Shortfall (ES), enabling quantitative determination of the necessary sample size for optimizing large institutional portfolios under ES, based on portfolio size, confidence level, and desired error margin.

Paper Preview

Abstract

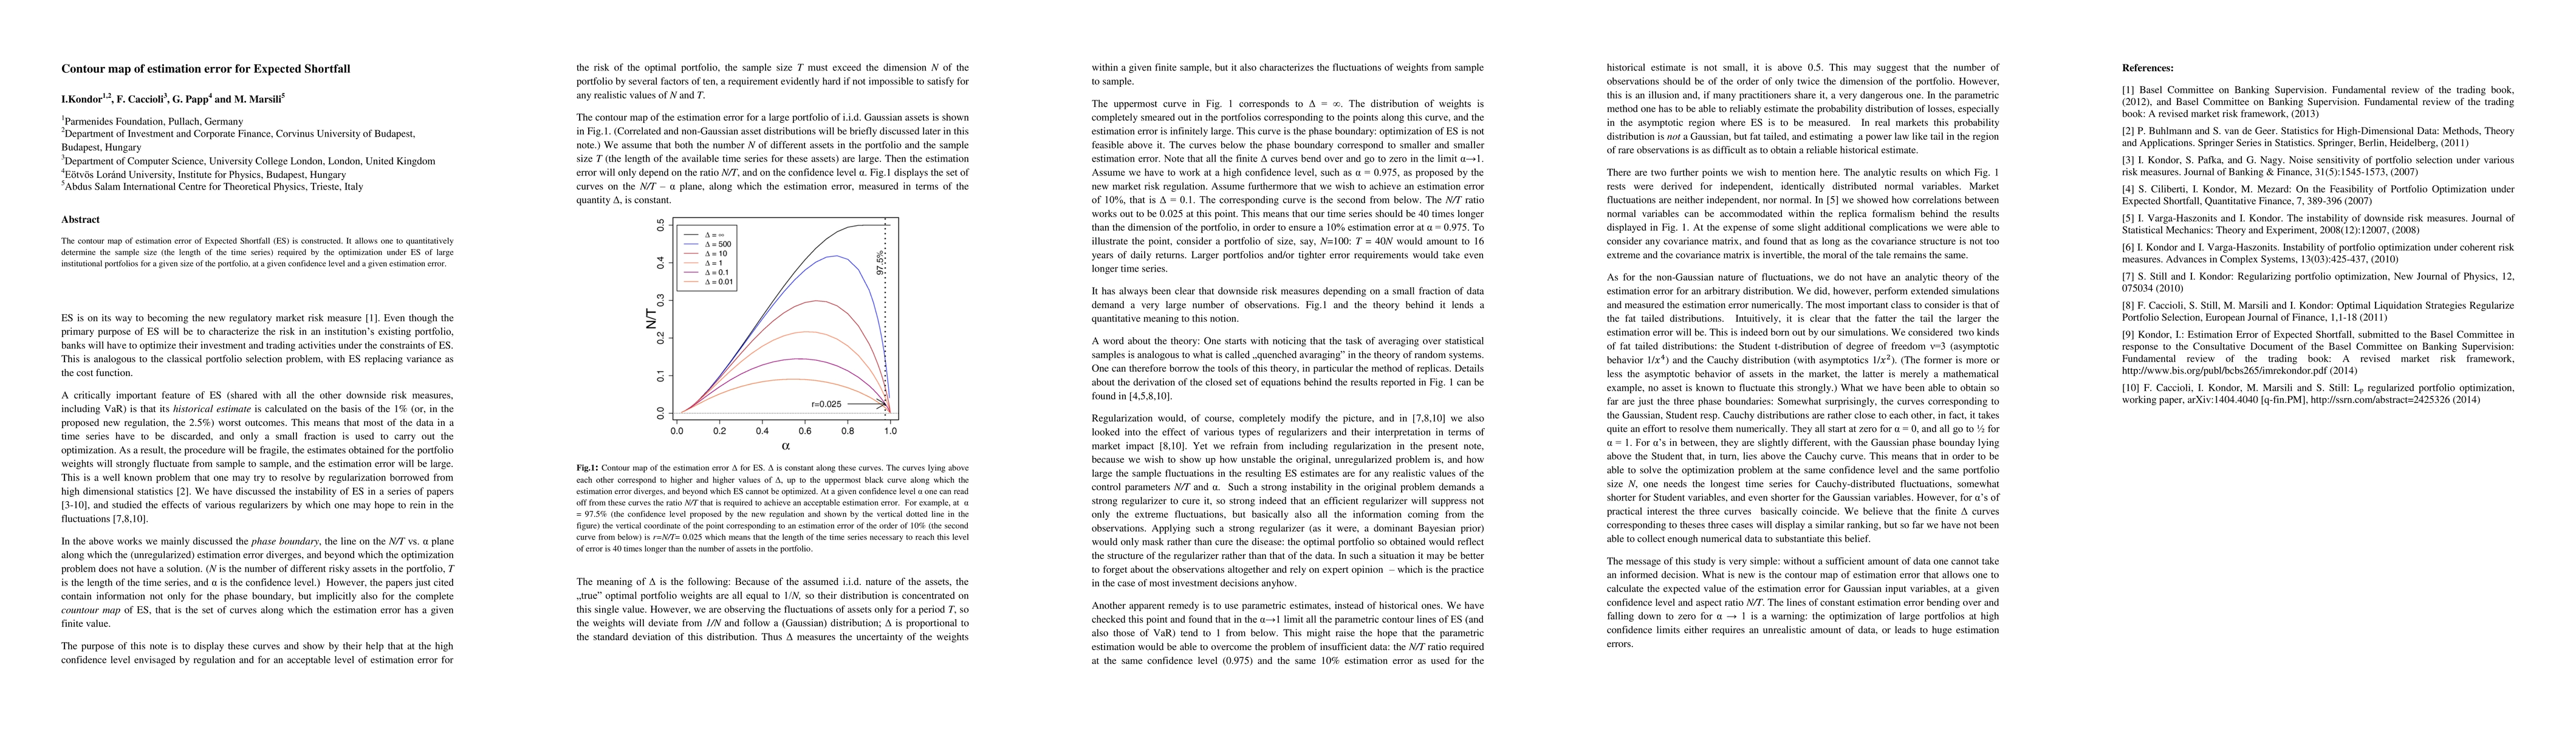
The contour map of estimation error of Expected Shortfall (ES) is constructed. It allows one to quantitatively determine the sample size (the length of the time series) required by the optimization under ES of large institutional portfolios for a given size of the portfolio, at a given confidence level and a given estimation error.

AI Key Findings

Get AI-generated insights about this paper's methodology, results, and significance.

Paper Details

Paper ID: 1502.06217
License: http://arxiv.org/licenses/nonexclusive-distrib/1.0/
Comments: 5 pages, 1 figure
Categories:
q-fin.RM q-fin.PM

How to Cite This Paper

BibTeX
@article{anon2015contour,
  title         = {Contour map of estimation error for Expected Shortfall},
  year          = {2015},
  eprint        = {1502.06217},
  archivePrefix = {arXiv},
  primaryClass  = {q-fin.RM},
}
APA 7
(2015). Contour map of estimation error for Expected Shortfall. arXiv. https://arxiv.org/abs/1502.06217
MLA 9
"Contour map of estimation error for Expected Shortfall." arXiv, 2015, arxiv.org/abs/1502.06217.

Key Terms

estimation (0.306)
error (0.293)
given (0.292)
confidence level (0.271)
size (0.265)
sample size (0.260)
quantitatively (0.242)
time series (0.230)

Citation Network

Current paper (gray), citations (green), references (blue)

Display is limited for performance on very large graphs.

Current Paper
Citations
References
Click to view
Title Authors Year Actions

Comments (0)

This website uses cookies to ensure you get the best experience. Learn more