Authors
Summary
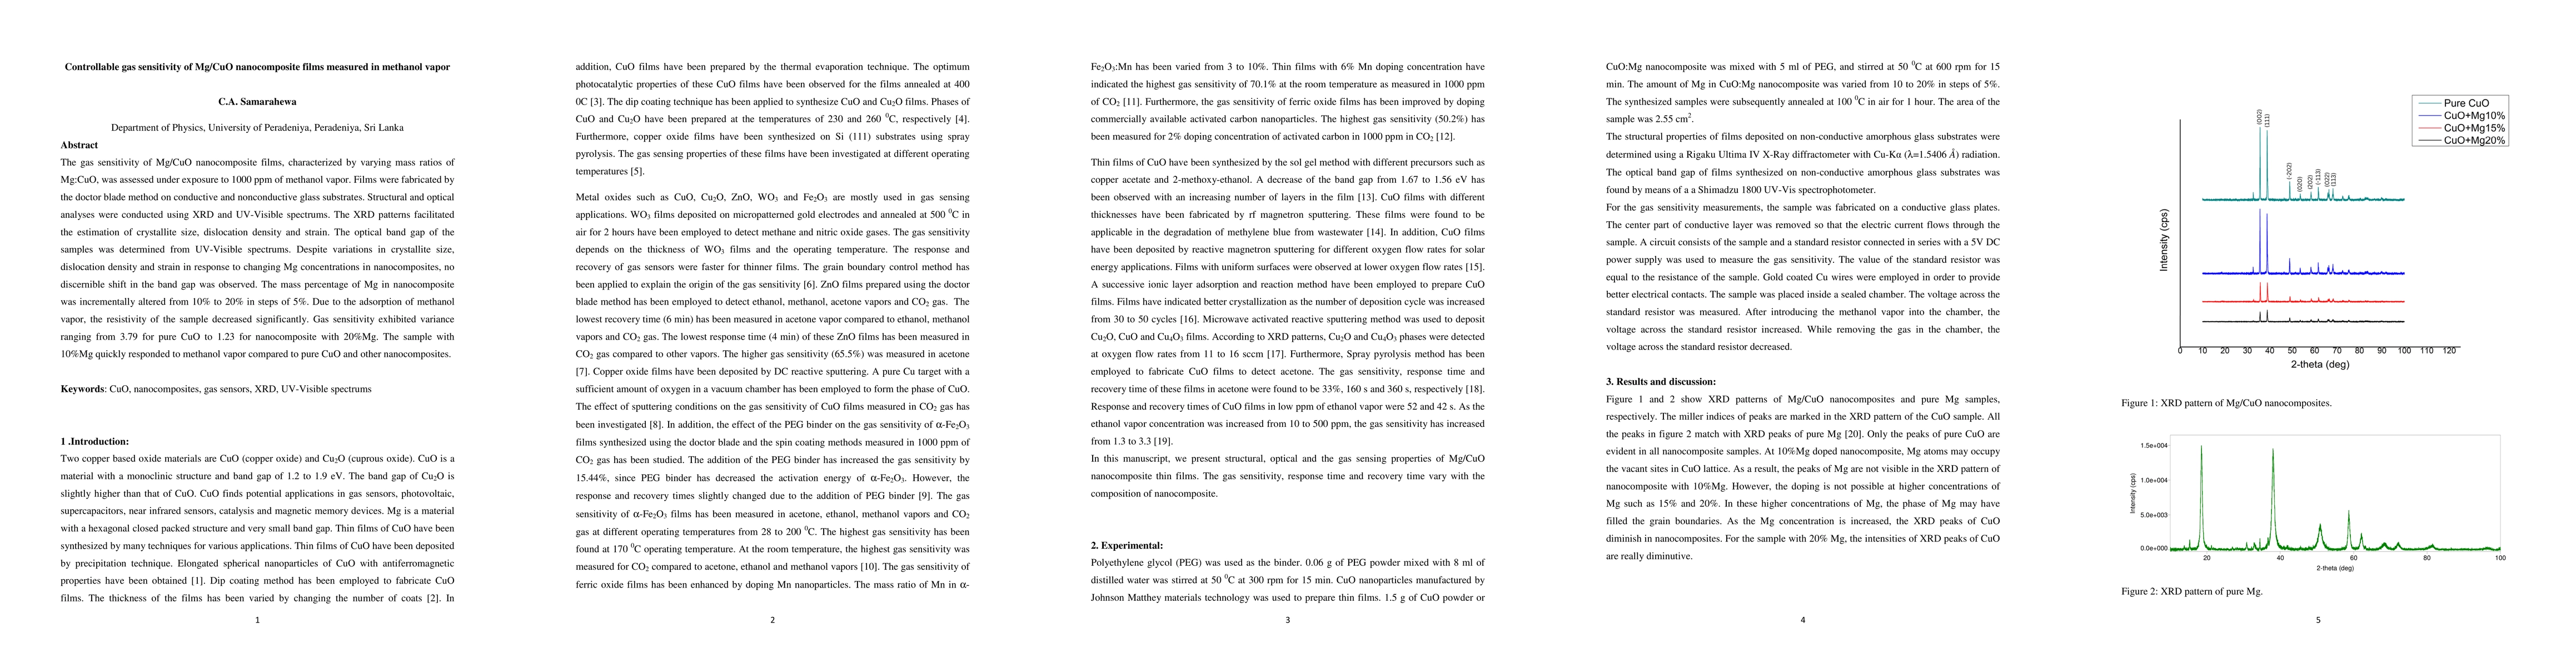
The gas sensitivity of Mg/CuO nanocomposite films, characterized by varying mass ratios of Mg:CuO, was assessed under exposure to 1000 ppm of methanol vapor. Films were fabricated by the doctor blade method on conductive and nonconductive glass substrates. Structural and optical analyses were conducted using XRD and UV-Visible spectrums. The XRD patterns facilitated the estimation of crystallite size, dislocation density and strain. The optical band gap of the samples was determined from UV-Visible spectrums. Despite variations in crystallite size, dislocation density and strain in response to changing Mg concentrations in nanocomposites, no discernible shift in the band gap was observed. The mass percentage of Mg in nanocomposite was incrementally altered from 10% to 20% in steps of 5%. Due to the adsorption of methanol vapor, the resistivity of the sample decreased significantly. Gas sensitivity exhibited variance ranging from 3.79 for pure CuO to 1.23 for nanocomposite with 20%Mg. The sample with 10%Mg quickly responded to methanol vapor compared to pure CuO and other nanocomposites. Keywords: CuO, nanocomposites, gas sensors, XRD, UV-Visible spectrums
AI Key Findings
Get AI-generated insights about this paper's methodology, results, and significance.
Paper Details
PDF Preview
Key Terms
Citation Network
Current paper (gray), citations (green), references (blue)
Display is limited for performance on very large graphs.
Similar Papers
Found 4 papersThermally-induced microstructural evolution in nanoparticle-based CuO, WO$_3$ and CuO-WO$_3$ thin films for hydrogen gas sensing
Jiří Čapek, Stanislav Haviar, Petr Zeman et al.
CALPHAD-based modelling of the temperature-composition-structure relationship during physical vapor deposition of Mg-Ca thin films
Jochen M. Schneider, Philipp Keuter, Shamsa Aliramaji et al.
Evaluation and comparison of NiO/CuO nanocomposite and NiO nanofibers as non-enzymatic electrochemical cholesterol biosensor
Zahra Gholami Shiri, Seyed Mojtaba Zebarjad, Kamal Janghorban
No citations found for this paper.
Comments (0)