Publication
Metrics
AI Quick Summary
Researchers used Blind Source Separation to create composite images from six EUV bands of solar observations, revealing empirical temperature maps of the corona with reduced data redundancy.
Paper Preview
Abstract
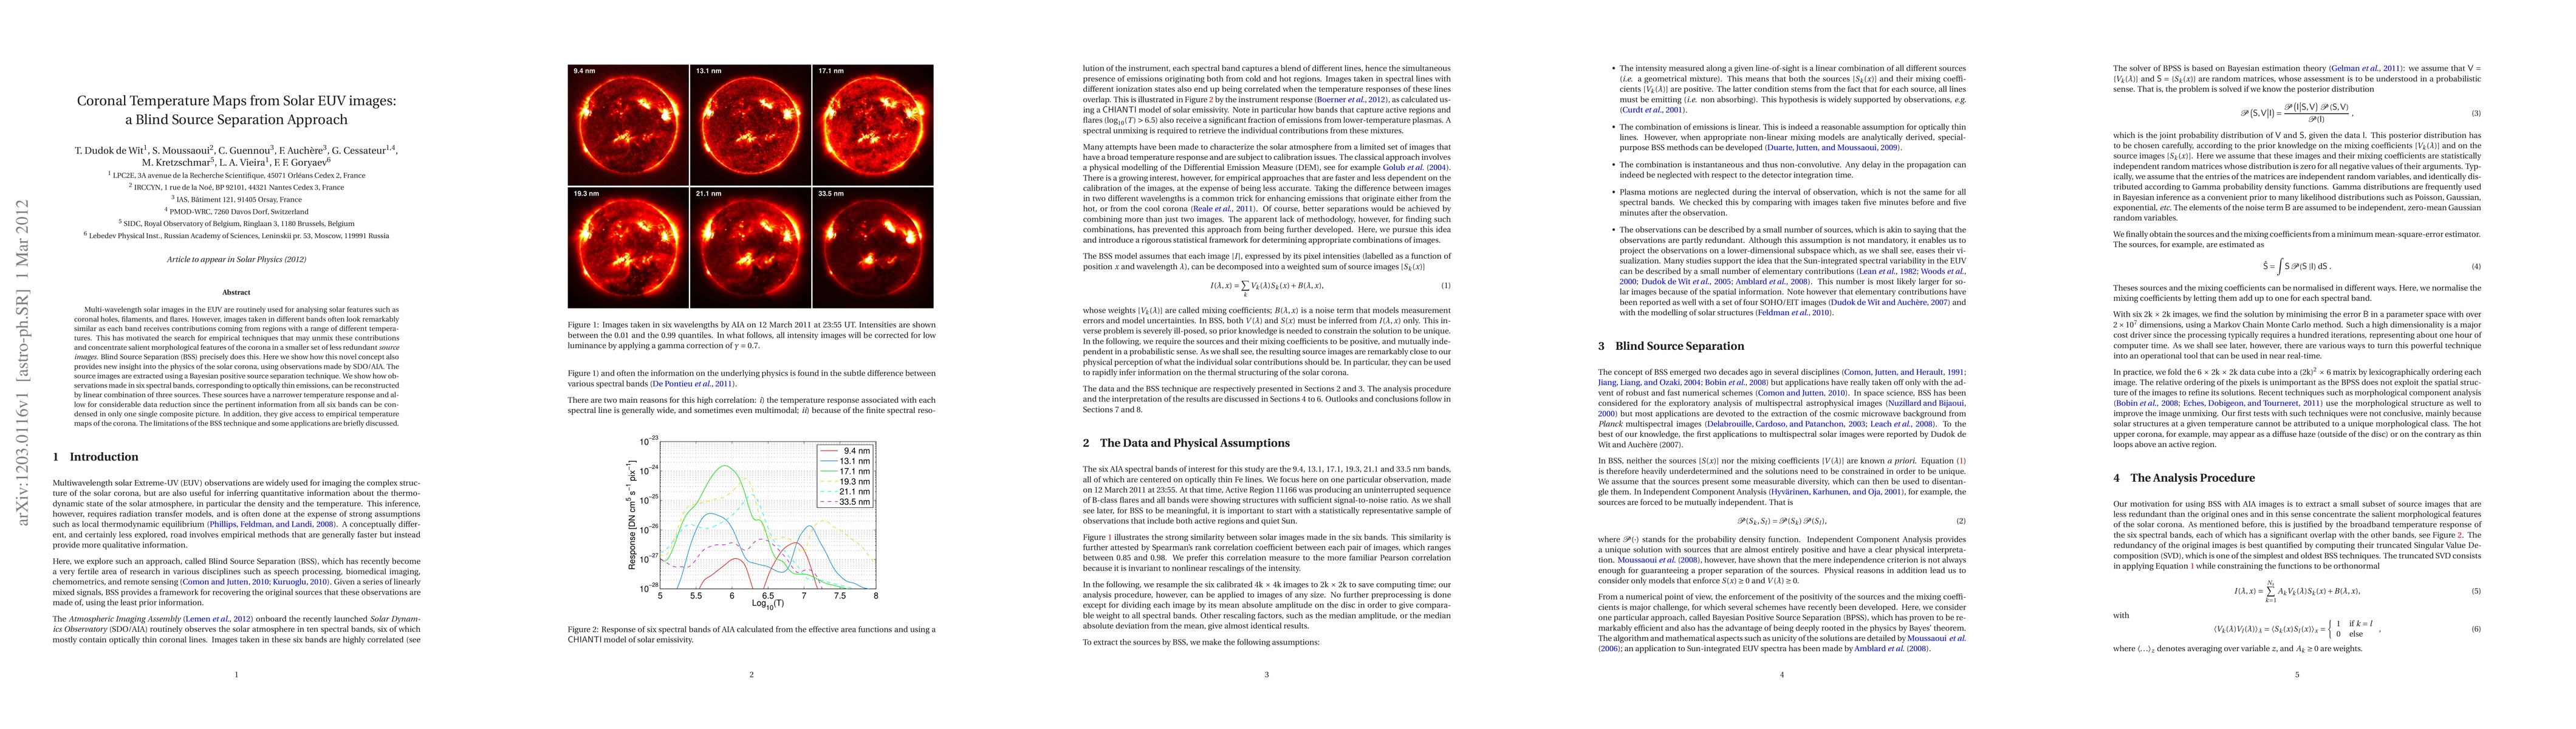
Multi-wavelength solar images in the EUV are routinely used for analysing solar features such as coronal holes, filaments, and flares. However, images taken in different bands often look remarkably similar as each band receives contributions coming from regions with a range of different temperatures. This has motivated the search for empirical techniques that may unmix these contributions and concentrate salient morphological features of the corona in a smaller set of less redundant source images. Blind Source Separation (BSS) precisely does this. Here we show how this novel concept also provides new insight into the physics of the solar corona, using observations made by SDO/AIA. The source images are extracted using a Bayesian positive source separation technique. We show how observations made in six spectral bands, corresponding to optically thin emissions, can be reconstructed by linear combination of three sources. These sources have a narrower temperature response and allow for considerable data reduction since the pertinent information from all six bands can be condensed in only one single composite picture. In addition, they give access to empirical temperature maps of the corona. The limitations of the BSS technique and some applications are briefly discussed.
AI Key Findings
Get AI-generated insights about this paper's methodology, results, significance, and more — seven facets brought into focus.
Impact
Paper Details
PDF Preview
Key Terms
Citation Network
Current paper (gray), citations (green), references (blue)
Display is limited for performance on very large graphs.
Discussion 0