Coronary Artery Disease Classification Using One-dimensional Convolutional Neural Network
Publication
Metrics
AI Quick Summary
This study proposes using one-dimensional convolutional neural networks (1D-CNN) to enhance the detection accuracy of Coronary Artery Disease (CAD) from ECG signals, demonstrating improved performance over traditional methods. The research highlights the significance of sample size in achieving high accuracy, with the best results obtained using a sample length of 250.
Paper Preview
Abstract
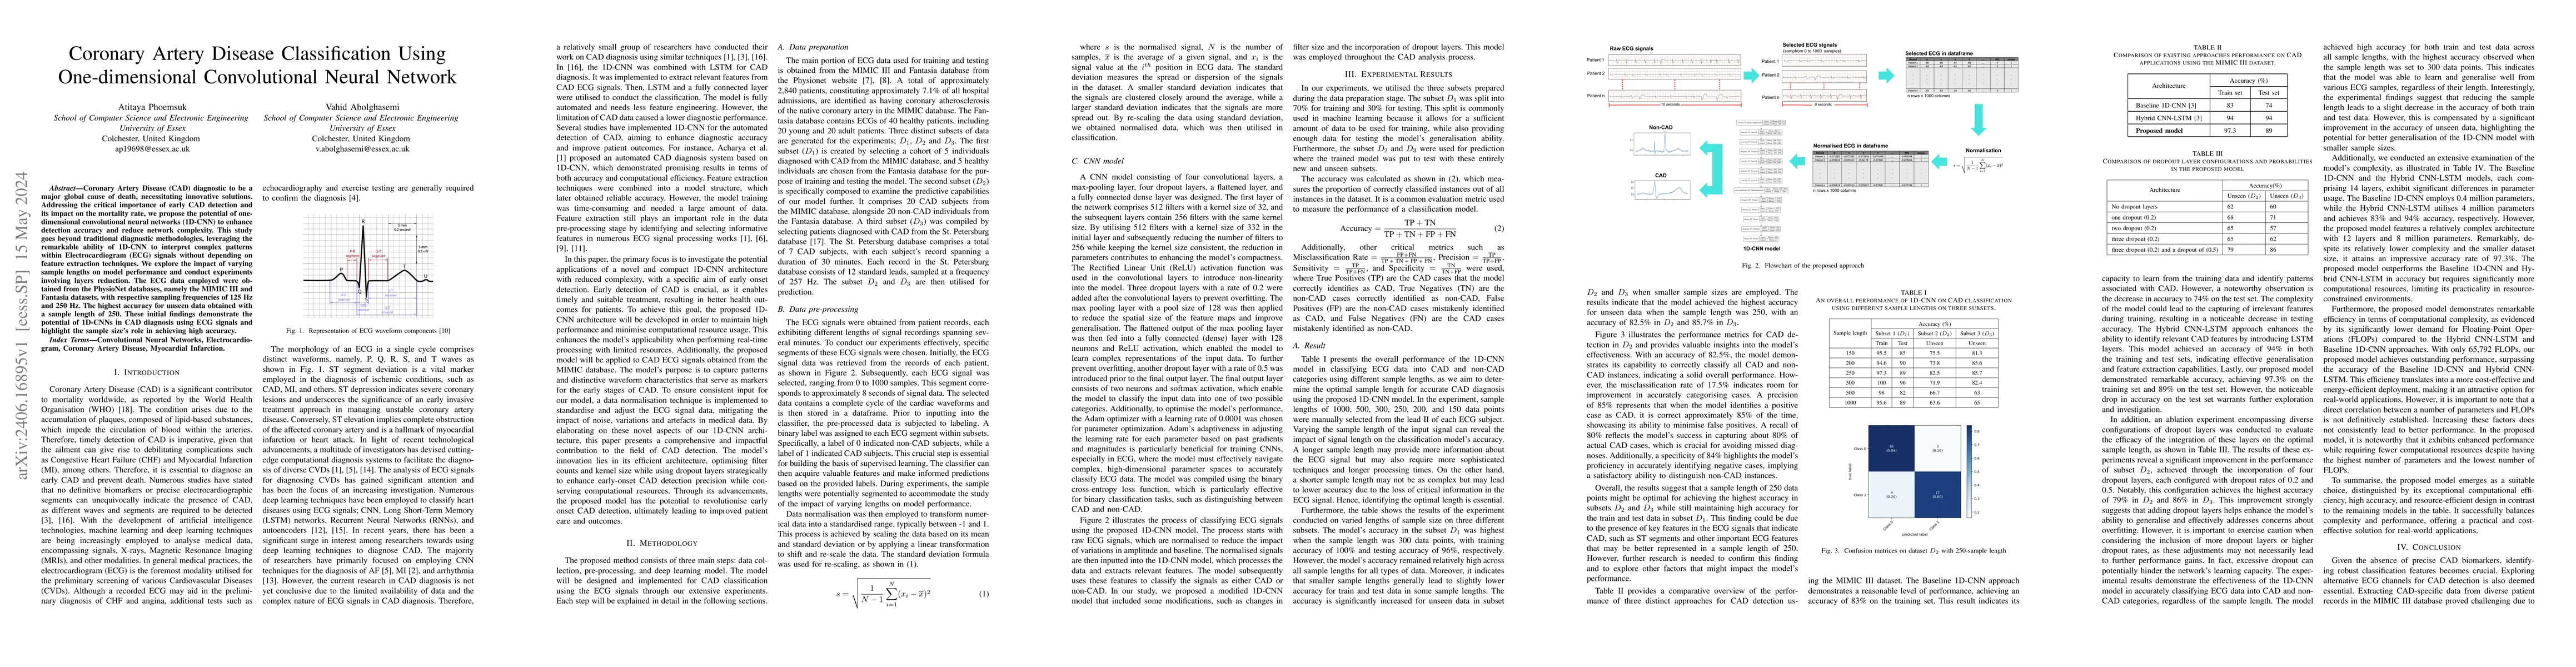
Coronary Artery Disease (CAD) diagnostic to be a major global cause of death, necessitating innovative solutions. Addressing the critical importance of early CAD detection and its impact on the mortality rate, we propose the potential of one-dimensional convolutional neural networks (1D-CNN) to enhance detection accuracy and reduce network complexity. This study goes beyond traditional diagnostic methodologies, leveraging the remarkable ability of 1D-CNN to interpret complex patterns within Electrocardiogram (ECG) signals without depending on feature extraction techniques. We explore the impact of varying sample lengths on model performance and conduct experiments involving layers reduction. The ECG data employed were obtained from the PhysioNet databases, namely the MIMIC III and Fantasia datasets, with respective sampling frequencies of 125 Hz and 250 Hz. The highest accuracy for unseen data obtained with a sample length of 250. These initial findings demonstrate the potential of 1D-CNNs in CAD diagnosis using ECG signals and highlight the sample size's role in achieving high accuracy.
AI Key Findings
Get AI-generated insights about this paper's methodology, results, significance, and more — seven facets brought into focus.
Impact
Paper Details
Authors
PDF Preview
Key Terms
Citation Network
Current paper (gray), citations (green), references (blue)
Display is limited for performance on very large graphs.
Discussion 0