Correcting invalid regression discontinuity designs with multiple time period data
Publication
Metrics
AI Quick Summary
This paper develops a theoretical framework to correct biases in Regression Discontinuity designs when the continuity assumption fails, especially when other policies affect the cutoff. It proposes a method using multiple time periods to identify causal effects and introduces bias-correction procedures and robust estimators for this setup, demonstrated through an application on Italian municipalities' fiscal laws.
Paper Preview
Abstract
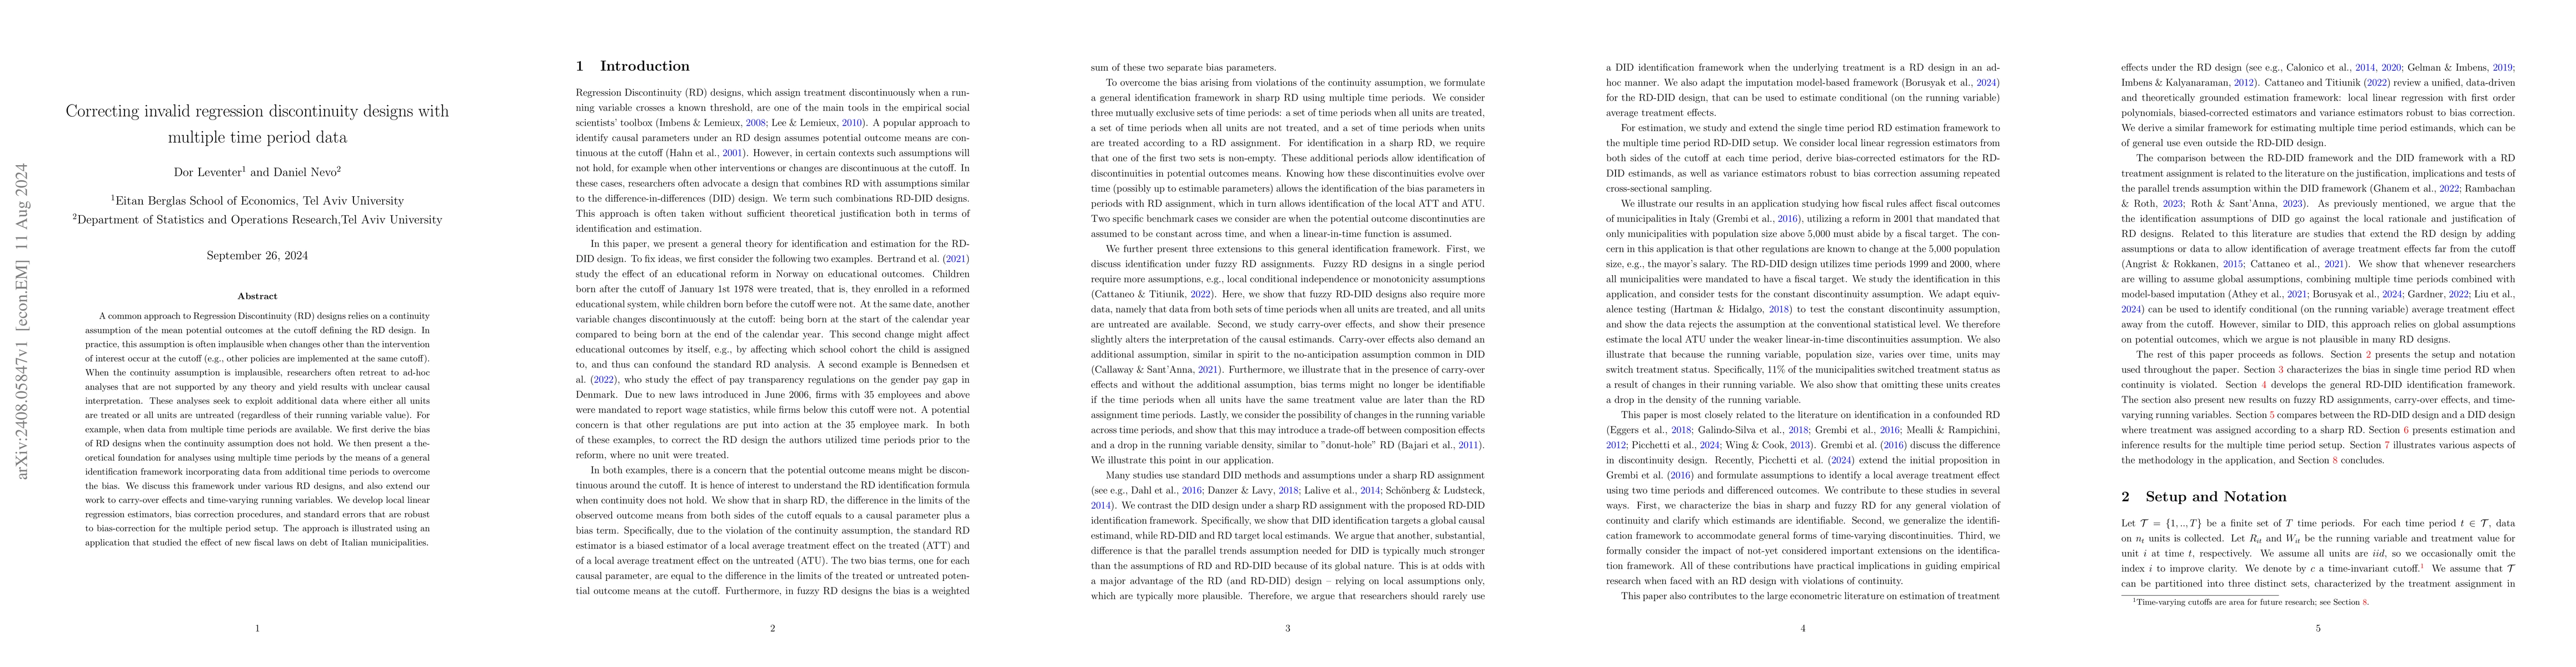
A common approach to Regression Discontinuity (RD) designs relies on a continuity assumption of the mean potential outcomes at the cutoff defining the RD design. In practice, this assumption is often implausible when changes other than the intervention of interest occur at the cutoff (e.g., other policies are implemented at the same cutoff). When the continuity assumption is implausible, researchers often retreat to ad-hoc analyses that are not supported by any theory and yield results with unclear causal interpretation. These analyses seek to exploit additional data where either all units are treated or all units are untreated (regardless of their running variable value). For example, when data from multiple time periods are available. We first derive the bias of RD designs when the continuity assumption does not hold. We then present a theoretical foundation for analyses using multiple time periods by the means of a general identification framework incorporating data from additional time periods to overcome the bias. We discuss this framework under various RD designs, and also extend our work to carry-over effects and time-varying running variables. We develop local linear regression estimators, bias correction procedures, and standard errors that are robust to bias-correction for the multiple period setup. The approach is illustrated using an application that studied the effect of new fiscal laws on debt of Italian municipalities.
AI Key Findings
Get AI-generated insights about this paper's methodology, results, significance, and more — seven facets brought into focus.
Impact
Authors
PDF Preview
Citation Network
Current paper (gray), citations (green), references (blue)
Display is limited for performance on very large graphs.
Discussion 0