Correlation between graphs with an application to brain networks analysis
Publication
Metrics
AI Quick Summary
This paper introduces a new method for estimating correlation between brain networks (graphs) using graph spectrum analysis. It demonstrates that the spectral radius of a graph is linked to its generating model parameters, enabling correlation inference even when the exact model is unknown. The method is applied to fMRI data showing higher correlations between certain brain sub-networks in individuals with autism spectrum disorder compared to controls.
Paper Preview
Abstract
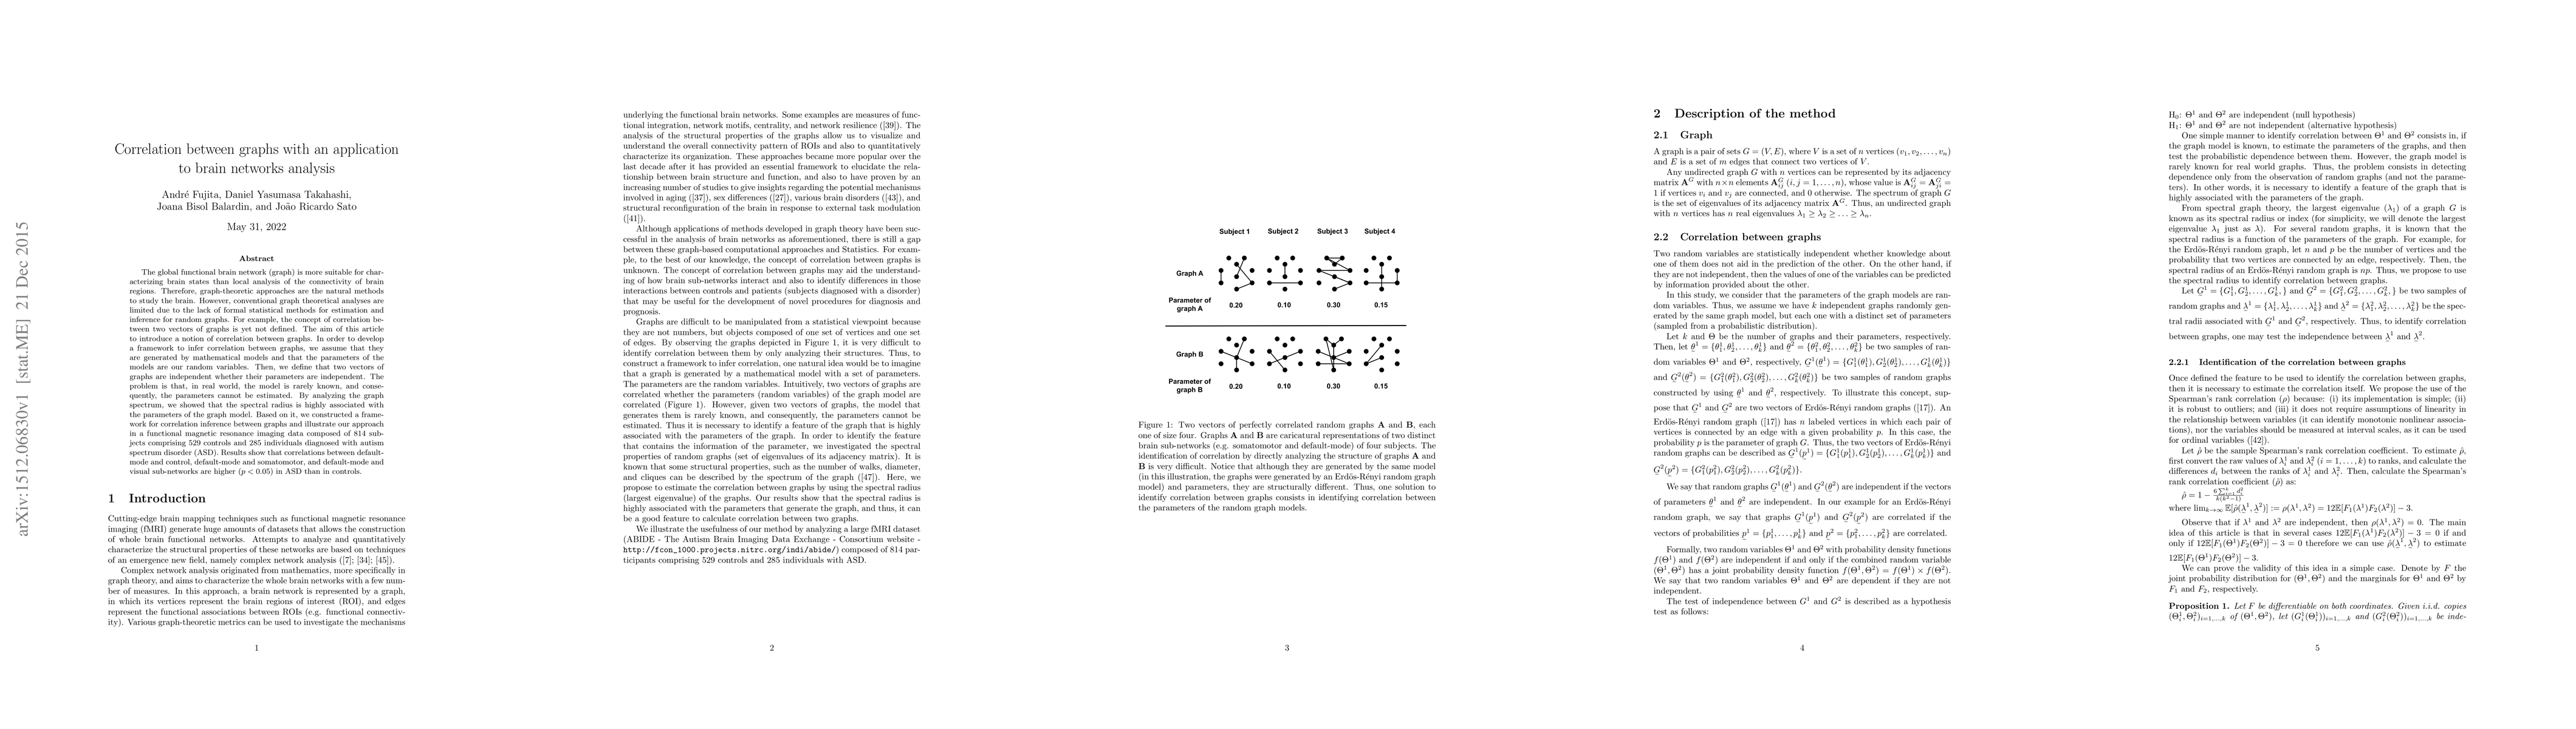
The global functional brain network (graph) is more suitable for characterizing brain states than local analysis of the connectivity of brain regions. Therefore, graph-theoretic approaches are the natural methods to study the brain. However, conventional graph theoretical analyses are limited due to the lack of formal statistical methods for estimation and inference for random graphs. For example, the concept of correlation between two vectors of graphs is yet not defined. The aim of this article to introduce a notion of correlation between graphs. In order to develop a framework to infer correlation between graphs, we assume that they are generated by mathematical models and that the parameters of the models are our random variables. Then, we define that two vectors of graphs are independent whether their parameters are independent. The problem is that, in real world, the model is rarely known, and consequently, the parameters cannot be estimated. By analyzing the graph spectrum, we showed that the spectral radius is highly associated with the parameters of the graph model. Based on it, we constructed a framework for correlation inference between graphs and illustrate our approach in a functional magnetic resonance imaging data composed of 814 subjects comprising 529 controls and 285 individuals diagnosed with autism spectrum disorder (ASD). Results show that correlations between default-mode and control, default-mode and somatomotor, and default-mode and visual sub-networks are higher ($p<0.05$) in ASD than in controls.
AI Key Findings
Get AI-generated insights about this paper's methodology, results, significance, and more — seven facets brought into focus.
Impact
Paper Details
PDF Preview
Key Terms
Citation Network
Current paper (gray), citations (green), references (blue)
Display is limited for performance on very large graphs.
Discussion 0