COSE: A Consistency-Sensitivity Metric for Saliency on Image Classification
Publication
Metrics
AI Quick Summary
The paper introduces the COSE metric to assess saliency methods' reliability in image classification, emphasizing their consistency and sensitivity through data augmentations. It reveals that while saliency methods are architecture-independent, GradCAM outperforms others but lacks variability for fine-grained datasets, highlighting the need for balancing consistency and sensitivity in saliency maps.
Paper Preview
Abstract
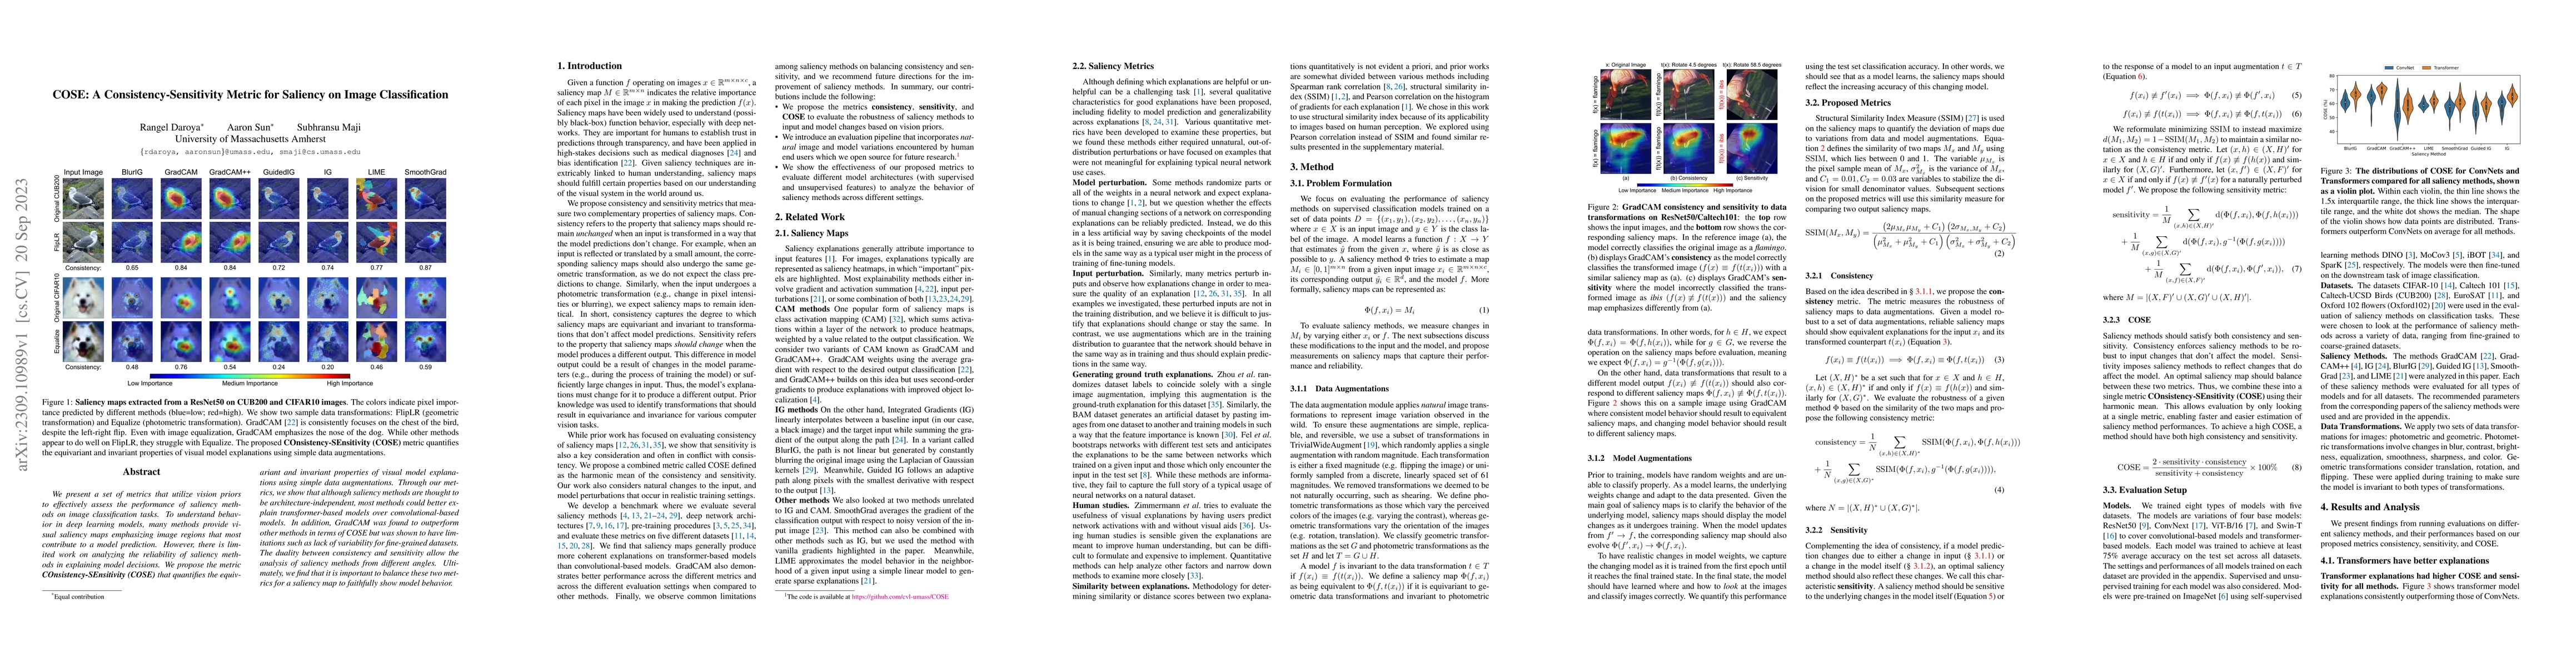
We present a set of metrics that utilize vision priors to effectively assess the performance of saliency methods on image classification tasks. To understand behavior in deep learning models, many methods provide visual saliency maps emphasizing image regions that most contribute to a model prediction. However, there is limited work on analyzing the reliability of saliency methods in explaining model decisions. We propose the metric COnsistency-SEnsitivity (COSE) that quantifies the equivariant and invariant properties of visual model explanations using simple data augmentations. Through our metrics, we show that although saliency methods are thought to be architecture-independent, most methods could better explain transformer-based models over convolutional-based models. In addition, GradCAM was found to outperform other methods in terms of COSE but was shown to have limitations such as lack of variability for fine-grained datasets. The duality between consistency and sensitivity allow the analysis of saliency methods from different angles. Ultimately, we find that it is important to balance these two metrics for a saliency map to faithfully show model behavior.
AI Key Findings
Get AI-generated insights about this paper's methodology, results, significance, and more — seven facets brought into focus.
Impact
Paper Details
Authors
PDF Preview
Key Terms
Citation Network
Current paper (gray), citations (green), references (blue)
Display is limited for performance on very large graphs.
Discussion 0