COVID-19: Forecasting mortality given mobility trend data and non-pharmaceutical interventions
Publication
Metrics
AI Quick Summary
This paper introduces a hybrid epidemiological model calibrated to evaluate the impact of mobility restrictions versus other non-pharmaceutical interventions on COVID-19 mortality. The model estimates that mobility restrictions contributed to 47% of the suppression of transmission both in the US and globally, with a mean absolute percentage error of 5.0% for US mortality forecasts and 6.7% worldwide.
Paper Preview
Abstract
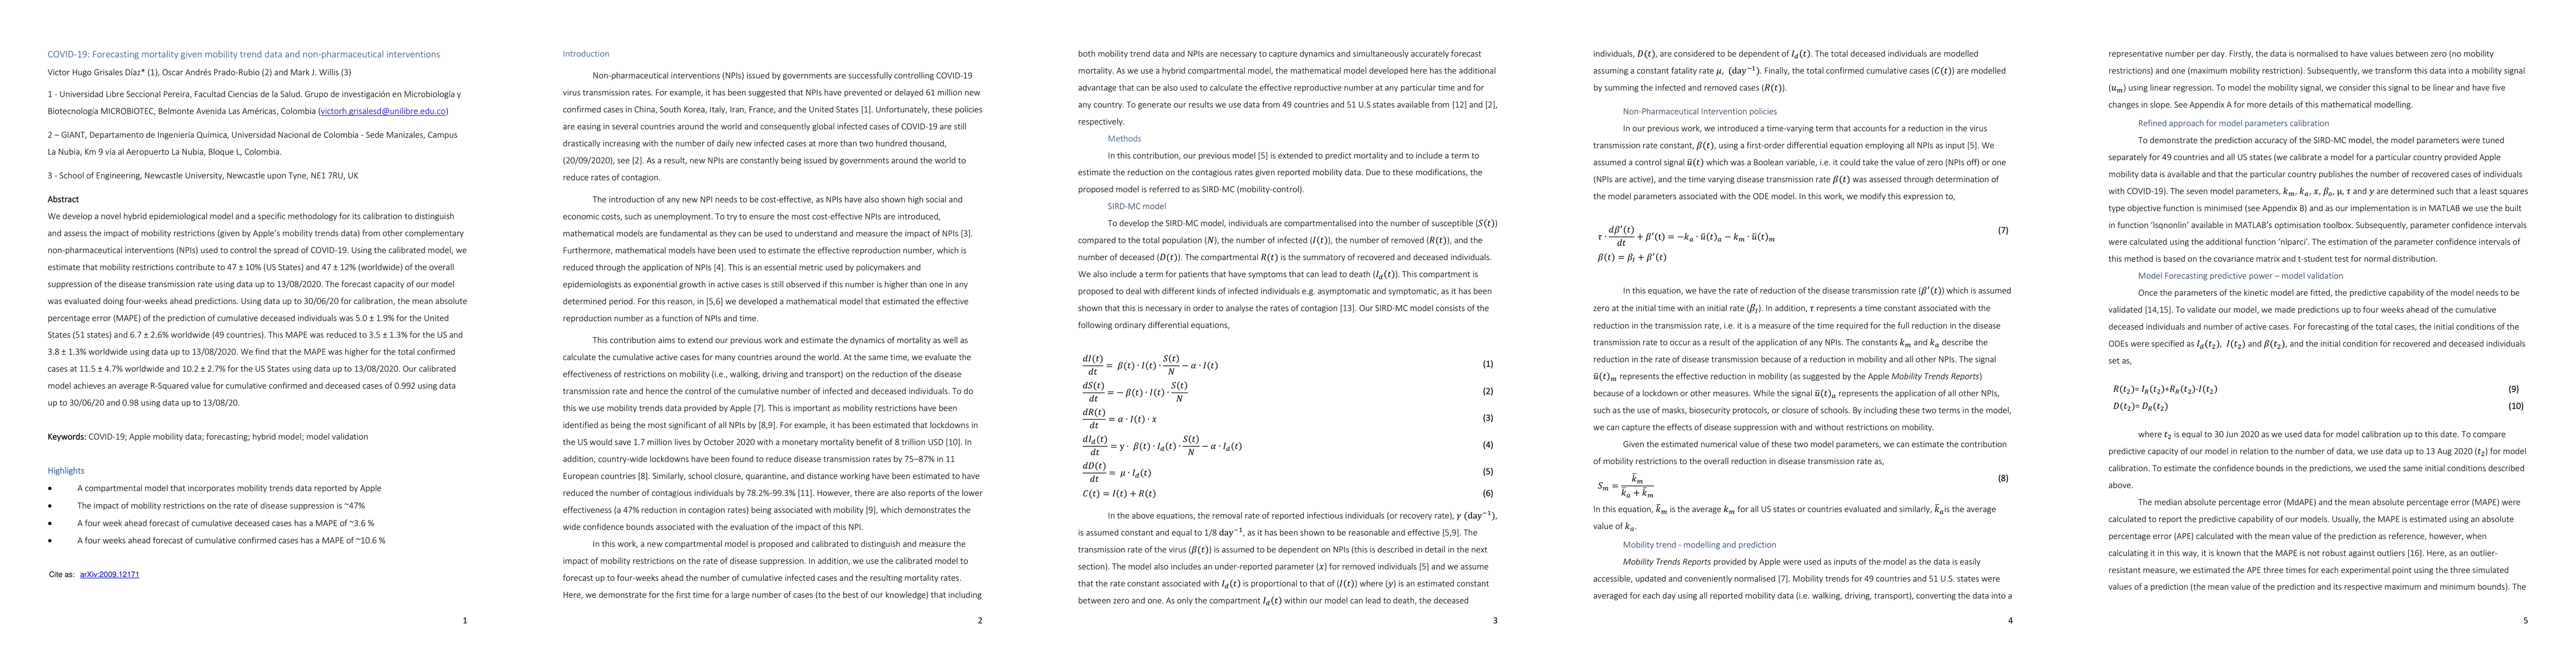
We develop a novel hybrid epidemiological model and a specific methodology for its calibration to distinguish and assess the impact of mobility restrictions (given by Apple's mobility trends data) from other complementary non-pharmaceutical interventions (NPIs) used to control the spread of COVID-19. Using the calibrated model, we estimate that mobility restrictions contribute to 47 % (US States) and 47 % (worldwide) of the overall suppression of the disease transmission rate using data up to 13/08/2020. The forecast capacity of our model was evaluated doing four-weeks ahead predictions. Using data up to 30/06/20 for calibration, the mean absolute percentage error (MAPE) of the prediction of cumulative deceased individuals was 5.0 % for the United States (51 states) and 6.7 % worldwide (49 countries). This MAPE was reduced to 3.5% for the US and 3.8% worldwide using data up to 13/08/2020. We find that the MAPE was higher for the total confirmed cases at 11.5% worldwide and 10.2% for the US States using data up to 13/08/2020. Our calibrated model achieves an average R-Squared value for cumulative confirmed and deceased cases of 0.992 using data up to 30/06/20 and 0.98 using data up to 13/08/20.
AI Key Findings
Get AI-generated insights about this paper's methodology, results, significance, and more — seven facets brought into focus.
Impact
Paper Details
PDF Preview
Key Terms
Citation Network
Current paper (gray), citations (green), references (blue)
Display is limited for performance on very large graphs.
Discussion 0