Publication
Metrics
AI Quick Summary
A study analyzed risk factors correlated with COVID-19 transmission growth rates in 126 countries, finding correlations with temperature, demographics, lifestyle habits, and blood types, suggesting that these factors contribute to the spread of the virus.
Paper Preview
Abstract
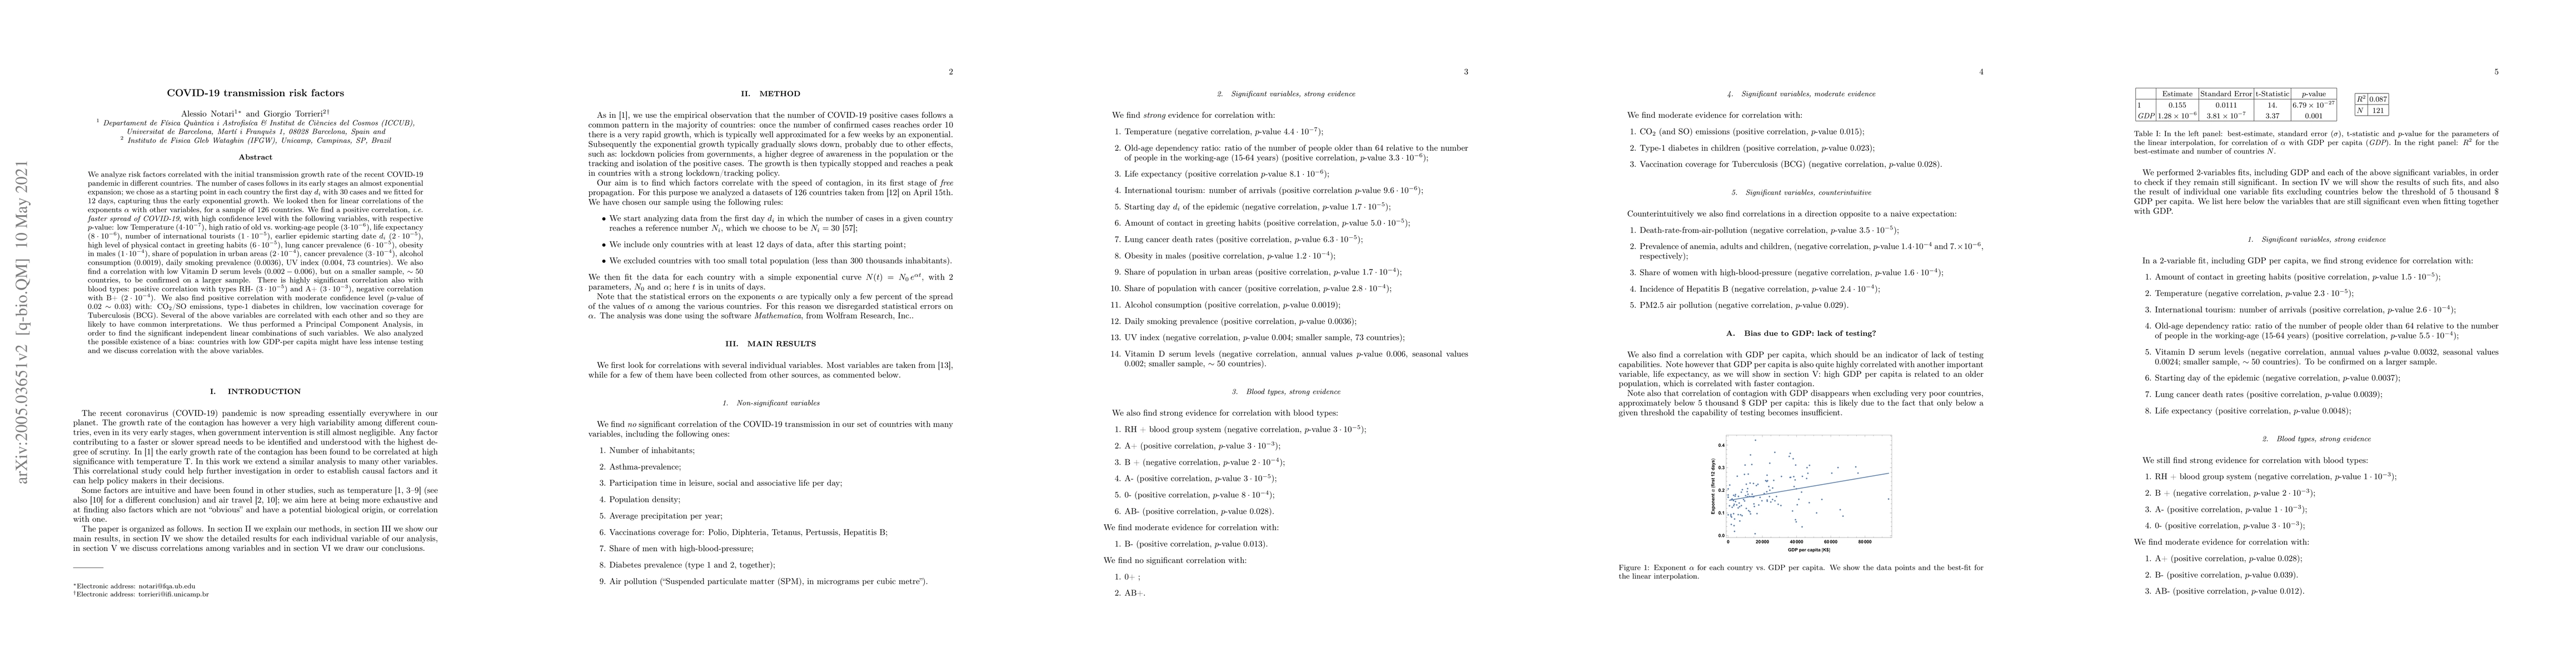
We analyze risk factors correlated with the initial transmission growth rate of the recent COVID-19 pandemic in different countries. The number of cases follows in its early stages an almost exponential expansion; we chose as a starting point in each country the first day $d_i$ with 30 cases and we fitted for 12 days, capturing thus the early exponential growth. We looked then for linear correlations of the exponents $\alpha$ with other variables, for a sample of 126 countries. We find a positive correlation, {\it i.e. faster spread of COVID-19}, with high confidence level with the following variables, with respective $p$-value: low Temperature ($4\cdot10^{-7}$), high ratio of old vs.~working-age people ($3\cdot10^{-6}$), life expectancy ($8\cdot10^{-6}$), number of international tourists ($1\cdot10^{-5}$), earlier epidemic starting date $d_i$ ($2\cdot10^{-5}$), high level of physical contact in greeting habits ($6 \cdot 10^{-5}$), lung cancer prevalence ($6 \cdot 10^{-5}$), obesity in males ($1 \cdot 10^{-4}$), share of population in urban areas ($2\cdot10^{-4}$), cancer prevalence ($3 \cdot 10^{-4}$), alcohol consumption ($0.0019$), daily smoking prevalence ($0.0036$), UV index ($0.004$, 73 countries). We also find a correlation with low Vitamin D levels ($0.002-0.006$, smaller sample, $\sim 50$ countries, to be confirmed on a larger sample). There is highly significant correlation also with blood types: positive correlation with types RH- ($3\cdot10^{-5}$) and A+ ($3\cdot10^{-3}$), negative correlation with B+ ($2\cdot10^{-4}$). Several of the above variables are intercorrelated and likely to have common interpretations. We performed a Principal Component Analysis, in order to find their significant independent linear combinations. We also analyzed a possible bias: countries with low GDP-per capita might have less testing and we discuss correlation with the above variables.
AI Key Findings
Get AI-generated insights about this paper's methodology, results, significance, and more — seven facets brought into focus.
Impact
Paper Details
Authors
PDF Preview
Key Terms
Citation Network
Current paper (gray), citations (green), references (blue)
Display is limited for performance on very large graphs.
Discussion 0