COVID-Pro in Italy: a dashboard for a province-based analysis
Publication
Metrics
AI Quick Summary
This paper introduces a COVID-19 analysis dashboard for Italy using daily data on positive cases and deaths, featuring time series plots and spatial distribution maps, along with a time-dependent adjusted SIRD model for province-level regions.
Paper Preview
Abstract
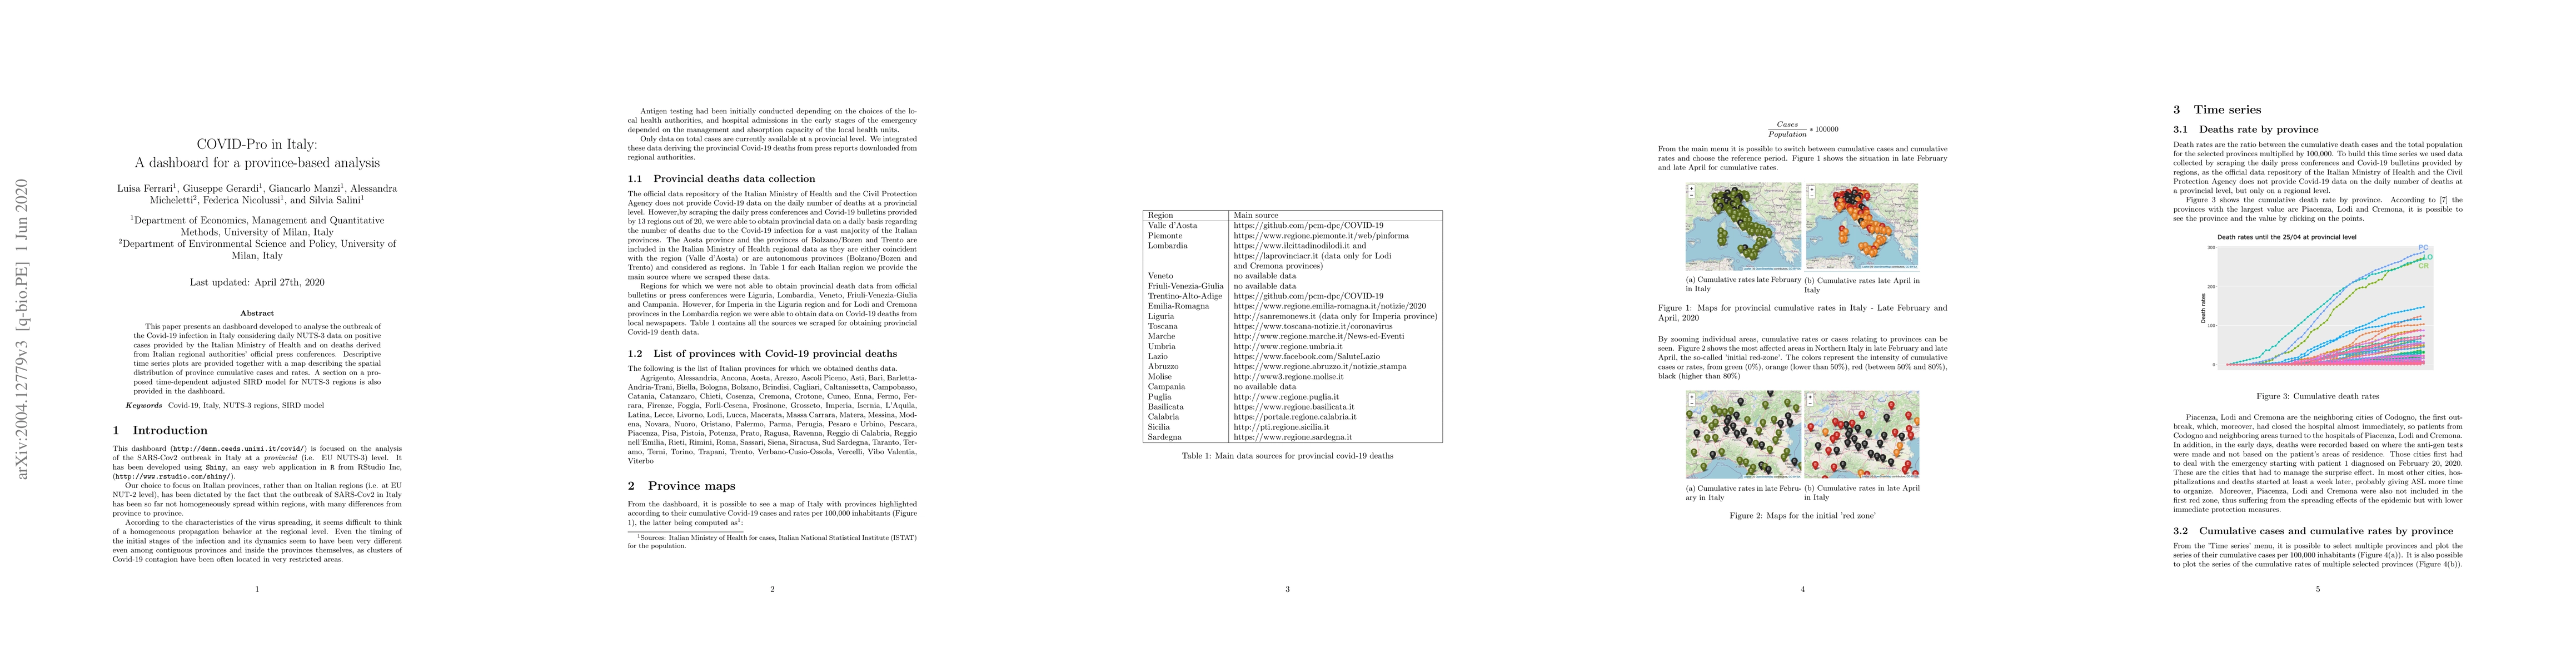
This paper presents an dashboard developed to analyse the outbreak of the Covid-19 infection in Italy considering daily NUTS-3 data on positive cases provided by the Italian Ministry of Health and on deaths derived from Italian regional authorities' official press conferences. Descriptive time series plots are provided together with a map describing the spatial distribution of province cumulative cases and rates. A section on a proposed time-dependent adjusted SIRD model for NUTS-3 regions is also provided in the dashboard.
AI Key Findings
Get AI-generated insights about this paper's methodology, results, significance, and more — seven facets brought into focus.
Impact
Paper Details
Authors
PDF Preview
Key Terms
Citation Network
Current paper (gray), citations (green), references (blue)
Display is limited for performance on very large graphs.
Discussion 0