covid19.analytics: An R Package to Obtain, Analyze and Visualize Data from the Coronavirus Disease Pandemic
Publication
Metrics
AI Quick Summary
This R package provides a tool for analyzing and visualizing COVID-19 pandemic data from publicly available resources. It offers a dashboard explorer to help researchers access, analyze, and understand the spread of the disease worldwide.
Paper Preview
Abstract
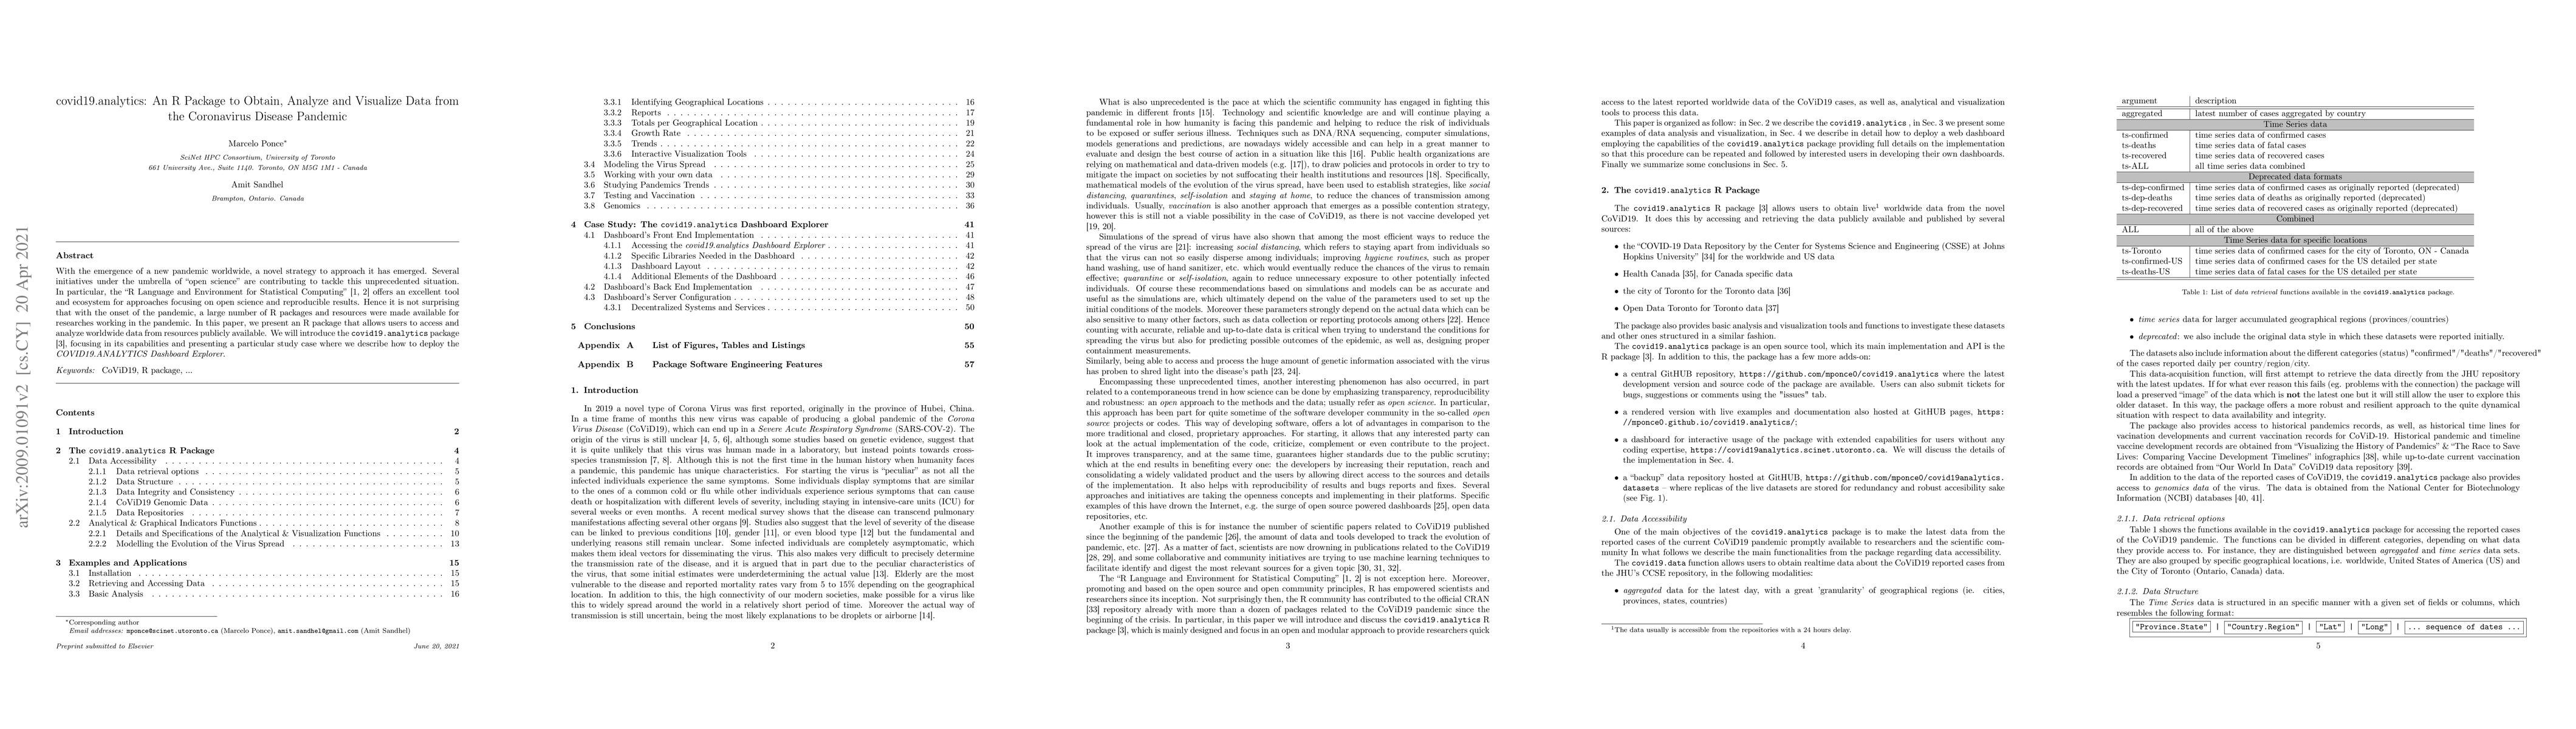
With the emergence of a new pandemic worldwide, a novel strategy to approach it has emerged. Several initiatives under the umbrella of "open science" are contributing to tackle this unprecedented situation. In particular, the "R Language and Environment for Statistical Computing" offers an excellent tool and ecosystem for approaches focusing on open science and reproducible results. Hence it is not surprising that with the onset of the pandemic, a large number of R packages and resources were made available for researches working in the pandemic. In this paper, we present an R package that allows users to access and analyze worldwide data from resources publicly available. We will introduce the covid19.analytics package, focusing in its capabilities and presenting a particular study case where we describe how to deploy the "COVID19.ANALYTICS Dashboard Explorer".
AI Key Findings
Get AI-generated insights about this paper's methodology, results, significance, and more — seven facets brought into focus.
Impact
Paper Details
PDF Preview
Key Terms
Citation Network
Current paper (gray), citations (green), references (blue)
Display is limited for performance on very large graphs.
Discussion 0