Cracking urban mobility
Publication
Metrics
AI Quick Summary
Researchers developed a model to assess urban mobility resilience by simulating cracks in road networks, finding Boston is more vulnerable than Manhattan due to its spatial correlations, and proposing potential solutions through rerouting and structural changes.
Paper Preview
Abstract
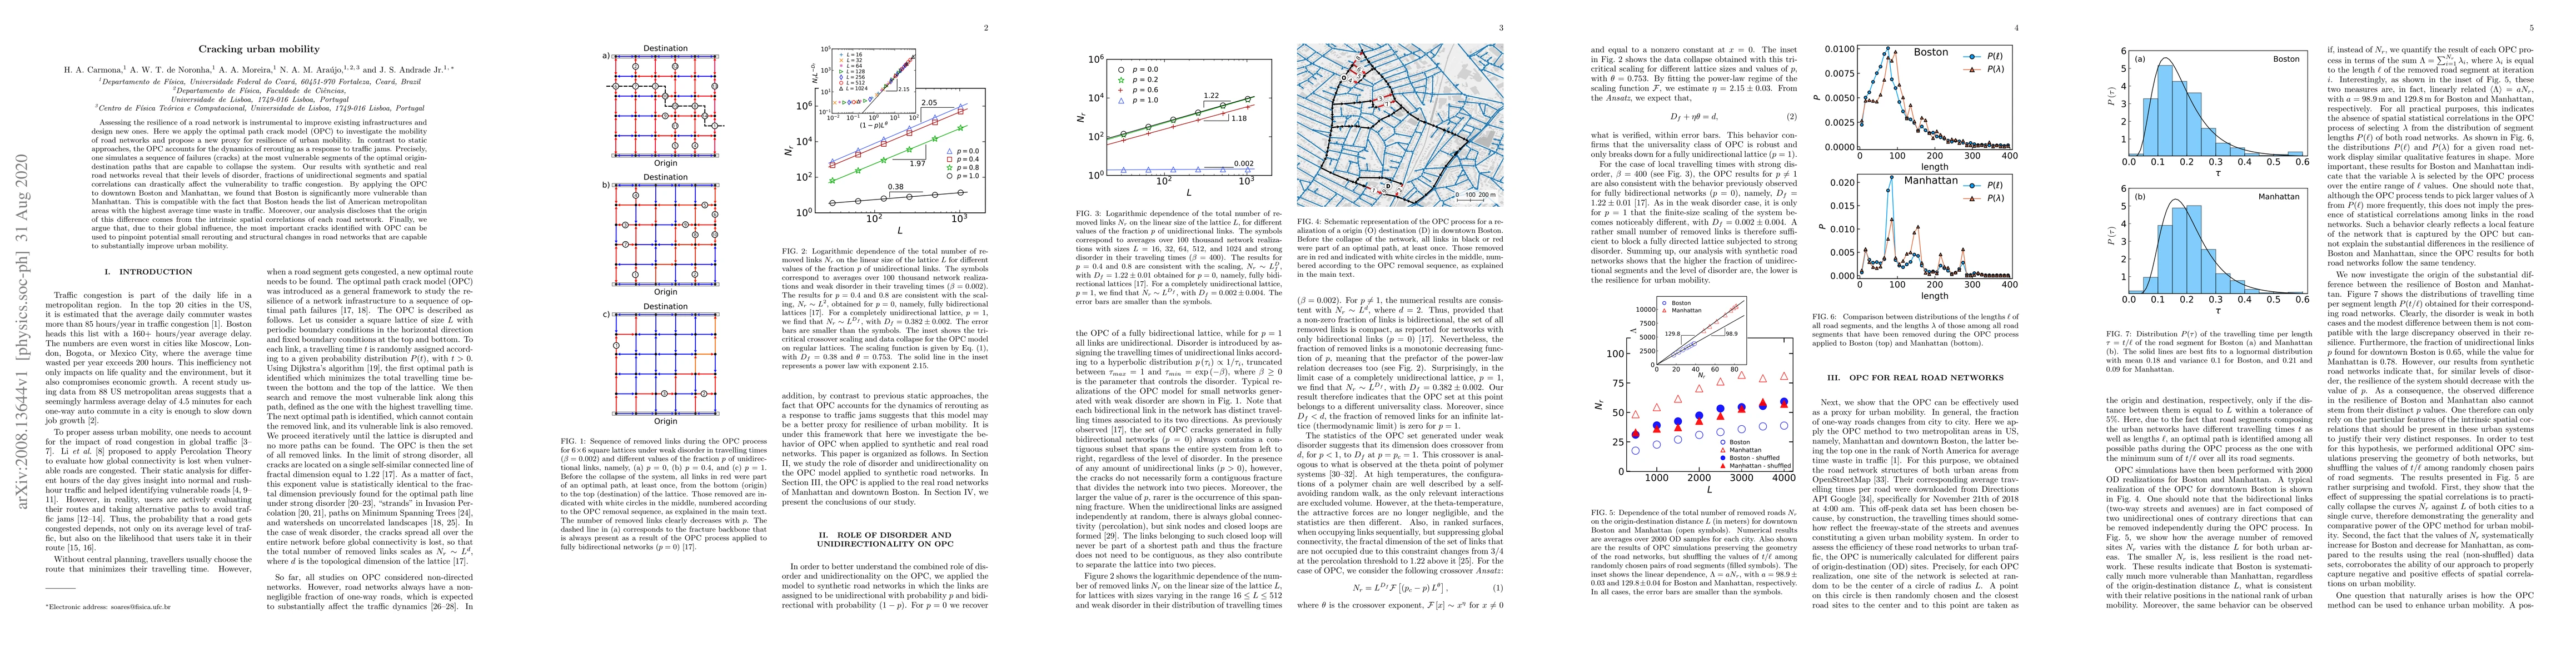
Assessing the resilience of a road network is instrumental to improve existing infrastructures and design new ones. Here we apply the optimal path crack model (OPC) to investigate the mobility of road networks and propose a new proxy for resilience of urban mobility. In contrast to static approaches, the OPC accounts for the dynamics of rerouting as a response to traffic jams. Precisely, one simulates a sequence of failures (cracks) at the most vulnerable segments of the optimal origin-destination paths that are capable to collapse the system. Our results with synthetic and real road networks reveal that their levels of disorder, fractions of unidirectional segments and spatial correlations can drastically affect the vulnerability to traffic congestion. By applying the OPC to downtown Boston and Manhattan, we found that Boston is significantly more vulnerable than Manhattan. This is compatible with the fact that Boston heads the list of American metropolitan areas with the highest average time waste in traffic. Moreover, our analysis discloses that the origin of this difference comes from the intrinsic spatial correlations of each road network. Finally, we argue that, due to their global influence, the most important cracks identified with OPC can be used to pinpoint potential small rerouting and structural changes in road networks that are capable to substantially improve urban mobility.
AI Key Findings
Get AI-generated insights about this paper's methodology, results, significance, and more — seven facets brought into focus.
Impact
Paper Details
Authors
PDF Preview
Key Terms
Citation Network
Current paper (gray), citations (green), references (blue)
Display is limited for performance on very large graphs.
Discussion 0